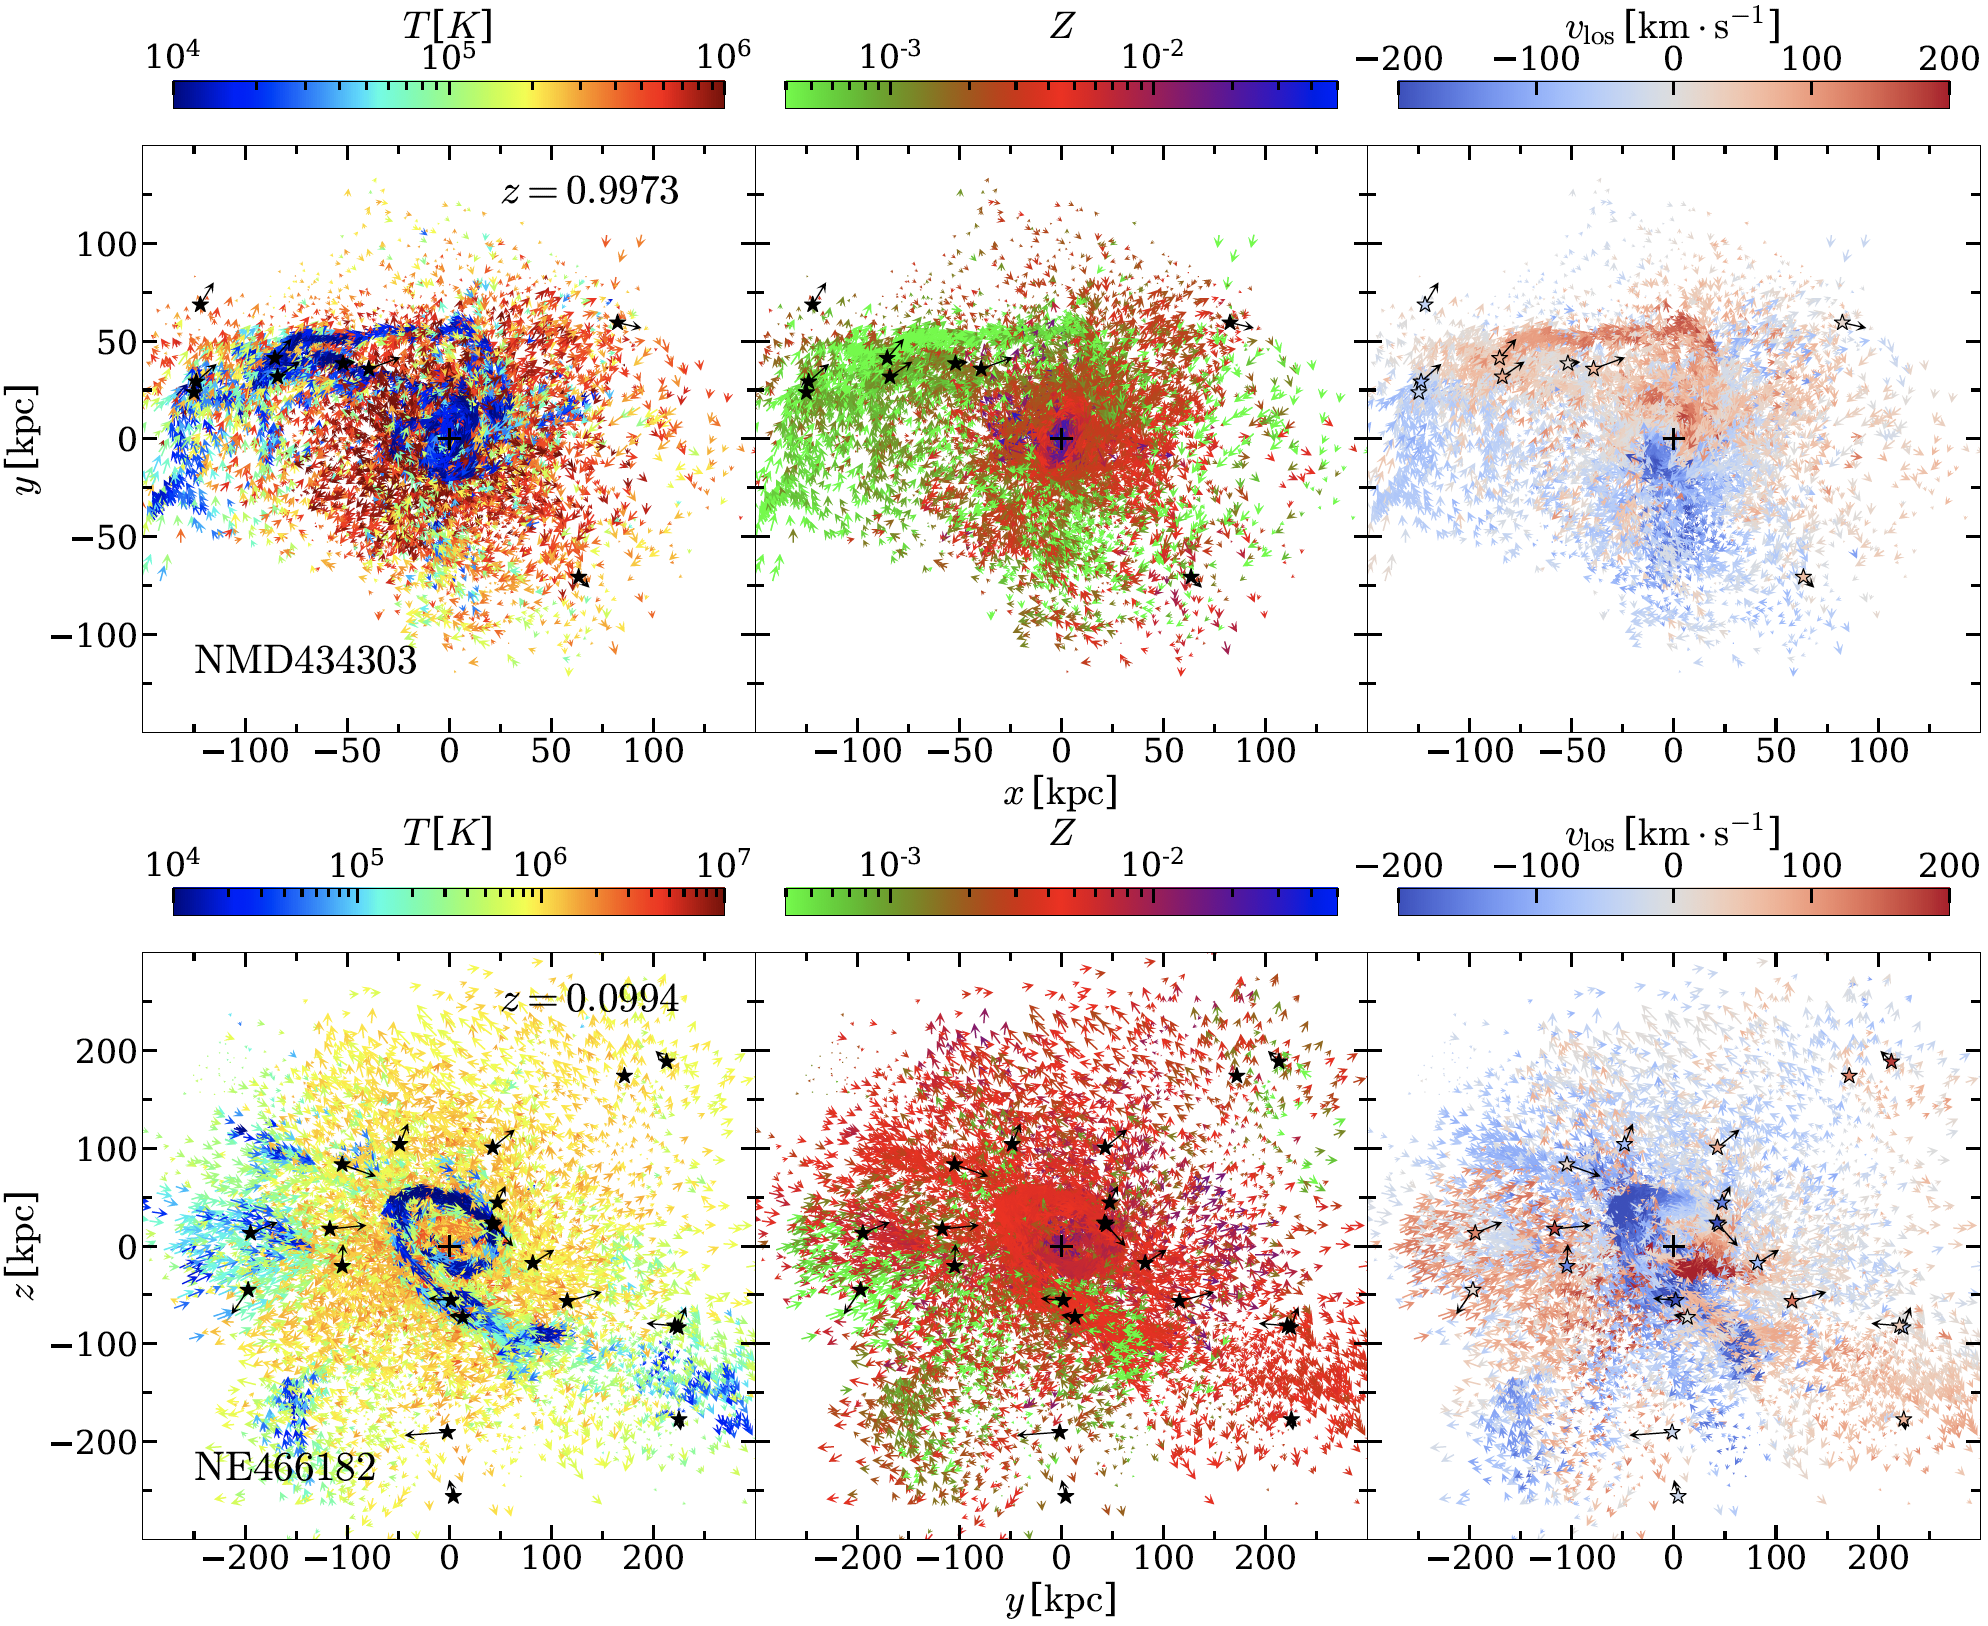
Gas configurations of a present-day normal massive disk galaxy ID-434303, when it was at z ~ 1 (top panel) and of a present-day quenched early-type galaxy ID-466182, when it was at z ~ 0.1 (botton panel). In each panel, the thin vectors indicate the velocities on the sky plane of the gas cells that are gravitationally-bounded to the central galaxy. The colors and the lengths of the vectors indicate the metallicity and the speeds of the gas cells. The black stars represent the satellite galaxies that have stellar masses larger than 1E9 solar masses and are located around the central galaxy. The black arrows associated with the satellite galaxies (black stars) represent the velocity of the satellites on the sky plane. For visual purposes, the normalization of the galaxy velocity vectors are 1.5 times that of the gas velocity vectors. The black plus symbol at the center represent the central galaxy.
... MORE
From large-scale environment to CGM angular momentum to galaxy star formation - II: quenched galaxies
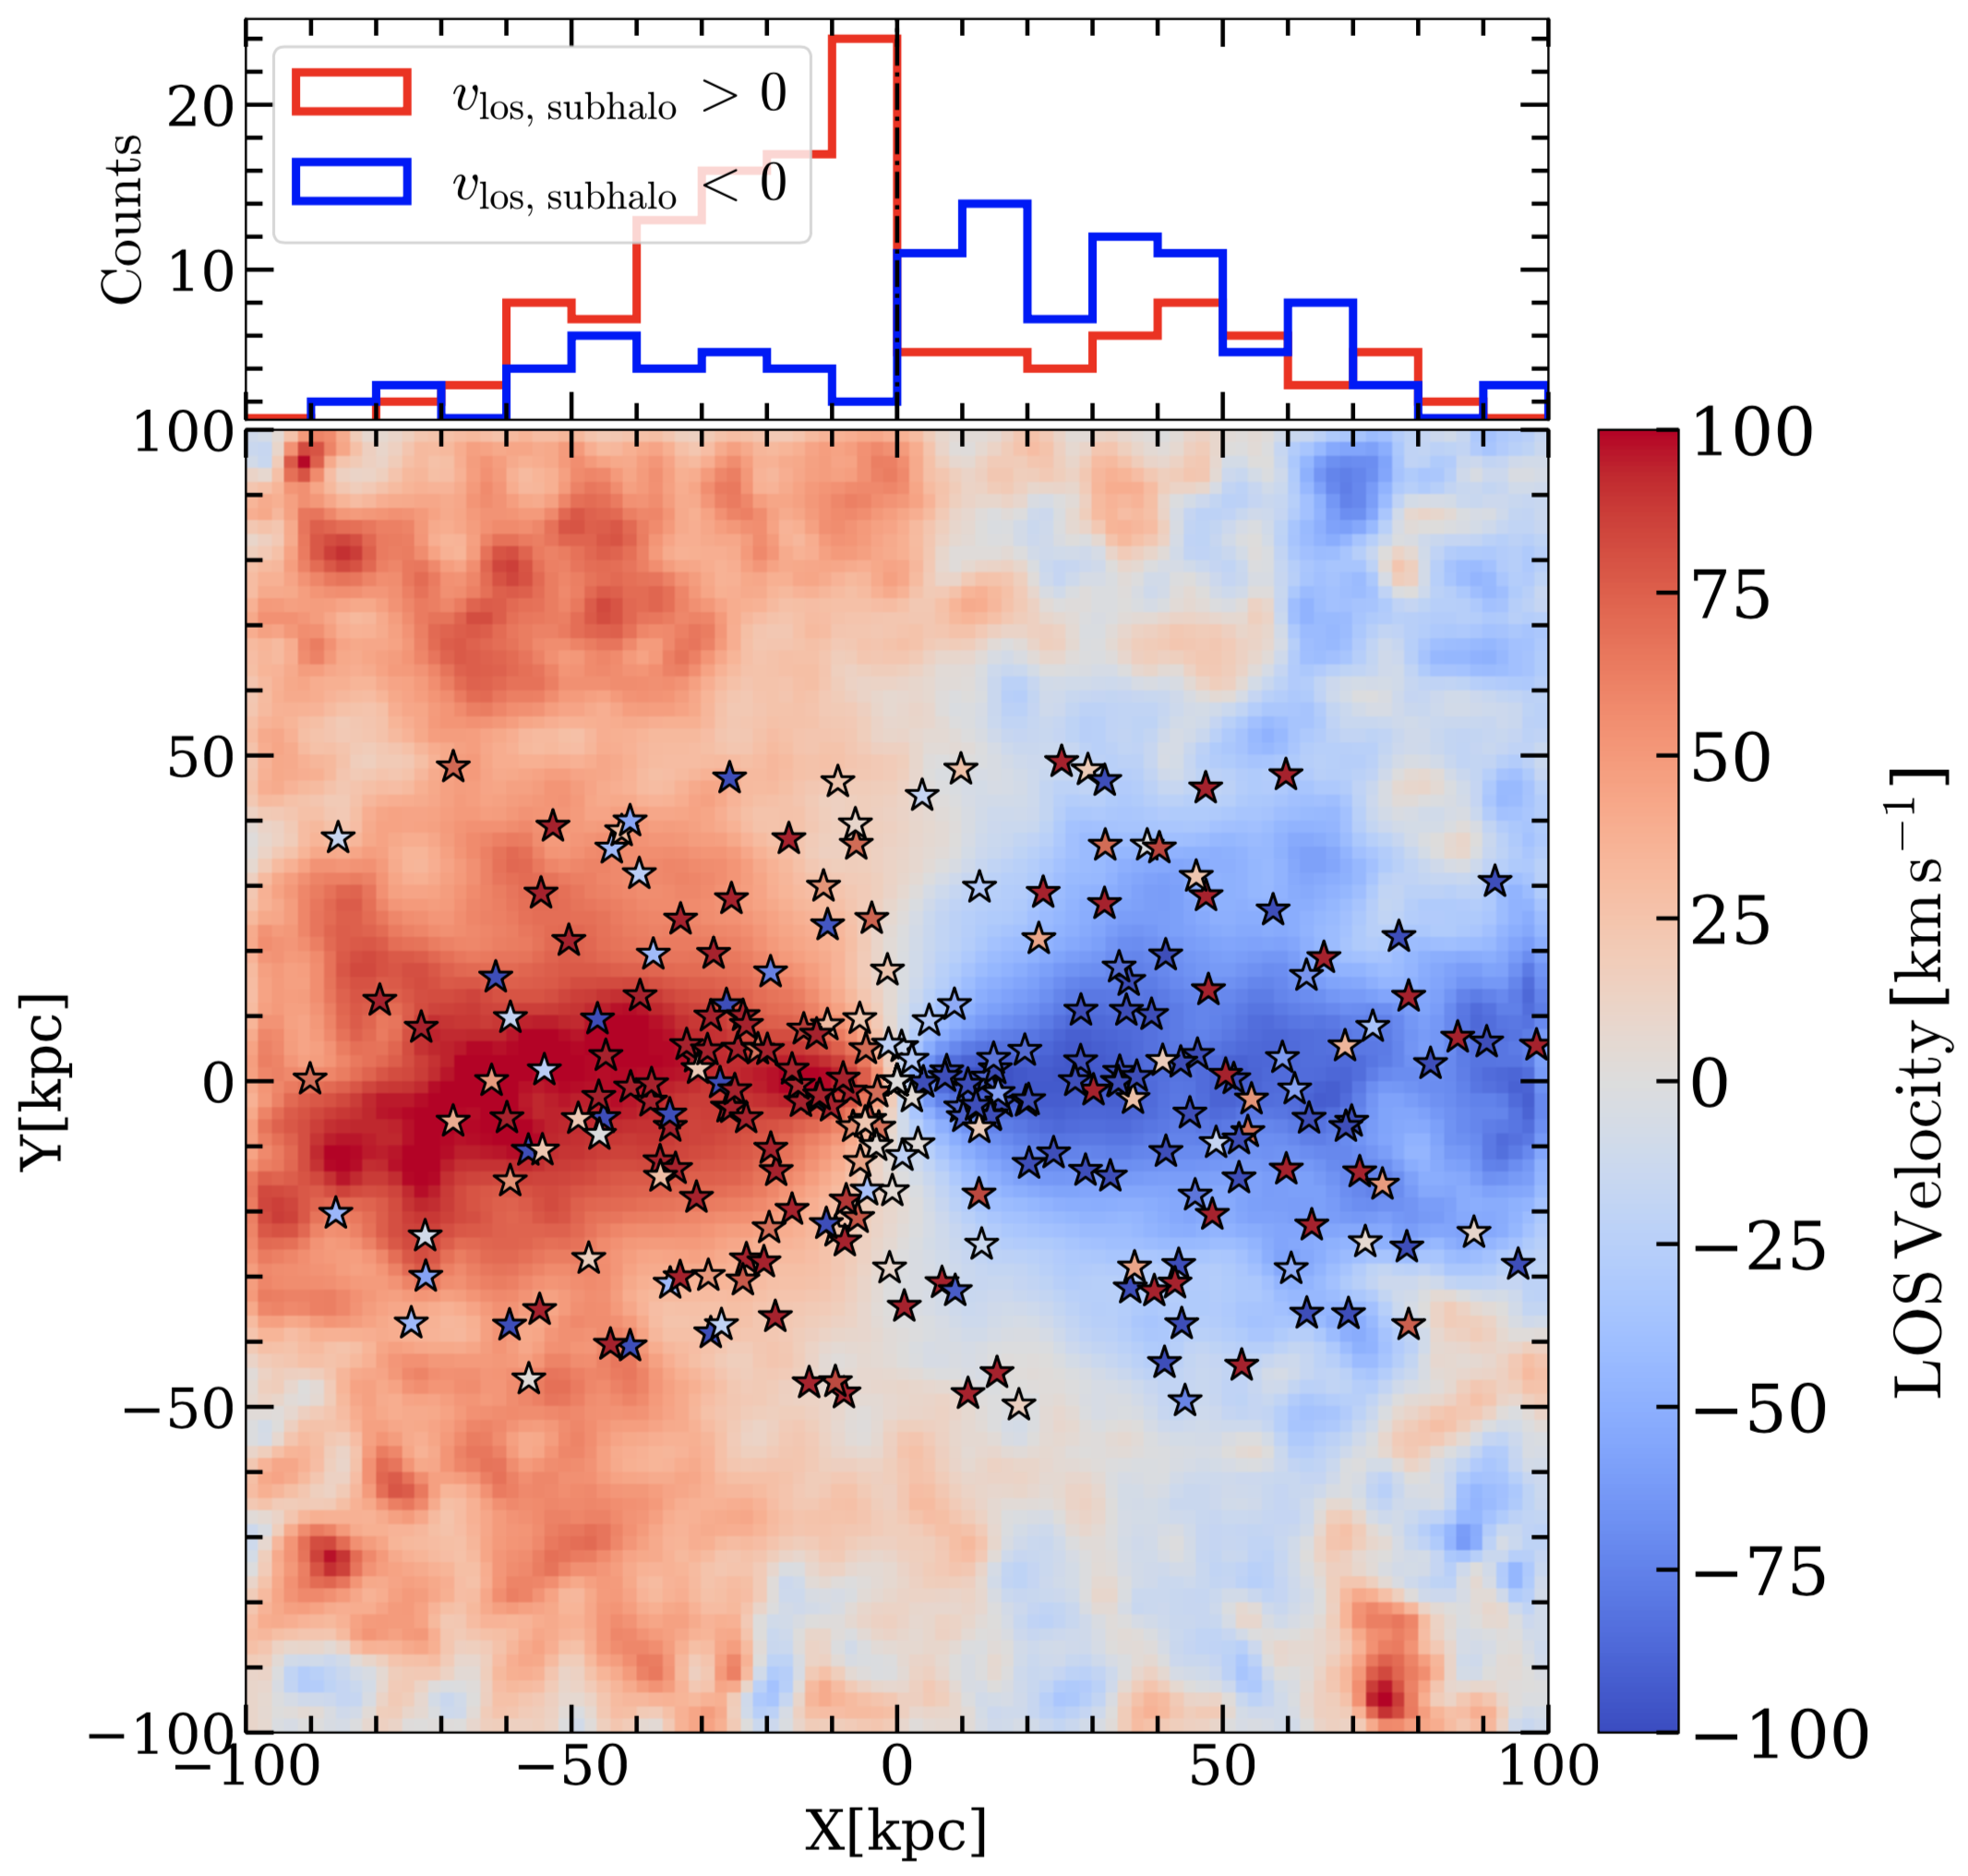
It is truly intriguing to see a coherent rotation pattern systematically existing across multiple distance scales, from the stellar disk (a few kpc), to the CGM gas (tens of kpc) and to neighbouring galaxies (up to 100 kpc). In the figure, stacked line-of-sight velocity fields of all the star-forming disks and the quenched but dynamically cold early-type galaxies at z = 0. Before stacking, all the galaxies are rotated to edge-on views according to their stellar disks such that the galaxy major axes are along the --axis in the figure. A further rotation with a random disk inclination angle between -60 and +60 degree along the major axis is then applied to each galaxy, in order to mimic a nearly edge-on view from an observation. The color-coded maps present the stacked signal of the line-of-sight velocity fields of the cold (1E4 K < T < 2E4 K) CGM gas. The star symbols with colors indicate the line-of-sight velocities of galaxies (with projected |Y| < 50 kpc) in the vicinity of the hosts. The histograms on the top of the figure show the spatial distributions along the X-axis (the major axis of the stellar disk) for neighbouring galaxies with positive (red-shifted) and negative (blue-shifted) line-of-sight velocities.
... MORE
Science Archive
A constant stellar-mass to light ratio M*/L has been widely-used in studies of galaxy dynamics and strong lensing, which aim at disentangling the mass density distributions of dark matter and baryons. In this work, we take early-type galaxies from the cosmological hydrodynamic IllustrisTNG-100 simulation to investigate possible systematic bias in the inferences due to a constant M*/L assumption. To do so, we construct two-component matter density models, where one component describes the dark matter distribution, the other one for the stellar mass, which is made to follow the light profile by assuming a constant factor of M*/L. Specifically, we adopt multiple commonly used dark matter models and light distributions. We fit the two-component models directly to the total matter density distributions of simulated galaxies to eliminate systematics from other modelling procedures. We find that galaxies in general have more centrally-concentrated stellar mass profile than their light distribution. This is more significant among more massive galaxies, for which the M*/L profile rises up markedly towards the centre and may often exhibit a dented feature due to on-going star formation at about one effective radius, encompassing a quenched bulge region. As a consequence, a constant M*/L causes a model degeneracy to be artificially broken under specific model assumptions, resulting in strong and model-dependent biases on estimated properties, such as the central dark matter fraction and the initial mass function. Either a steeper dark matter profile with an over-predicted density fraction, or an over-predicted stellar mass normalization (M*/L) is often obtained through model fitting. The exact biased behaviour depends on the slope difference between mass and light, as well as on the adopted models for dark matter and light.
Liang, Yan; Xu, Dandan; Sluse, D,; Sonnenfeld, A.; Shu, Y.P.
Submitted to Monthly Notices of the Royal Astronomical Society,
[ArXiv]
Conventional galaxy mass estimation methods suffer from model assumptions and degeneracies. Machine learning, which reduces the reliance on such assumptions, can be used to determine how well present-day observations can yield predictions for the distributions of stellar and dark matter. In this work, we use a general sample of galaxies from the TNG100 simulation to investigate the ability of multi-branch convolutional neural network (CNN) based machine learning methods to predict the central (i.e., within 1-2 effective radii) stellar and total masses, and the stellar mass-to-light ratio M_*/L. These models take galaxy images and spatially-resolved mean velocity and velocity dispersion maps as inputs. Such CNN-based models can in general break the degeneracy between baryonic and dark matter in the sense that the model can make reliable predictions on the individual contributions of each component. For example, with r-band images and two galaxy kinematic maps as inputs, our model predicting M_*/L has a prediction uncertainty of 0.04 dex. Moreover, to investigate which (global) features significantly contribute to the correct predictions of the properties above, we utilize a gradient boosting machine. We find that galaxy luminosity dominates the prediction of all masses in the central regions, with stellar velocity dispersion coming next. We also investigate the main contributing features when predicting stellar and dark matter mass fractions (f_*, f_DM) and the dark matter mass M_DM, and discuss the underlying astrophysics.
Chu, Jiani; Tang, Hongming; Xu, Dandan; Lu, Shengdong; Long, Richard
Monthly Notices of the Royal Astronomical Society, 2024, Volume 528, Issue 4, pp.6354-6369
[ArXiv]
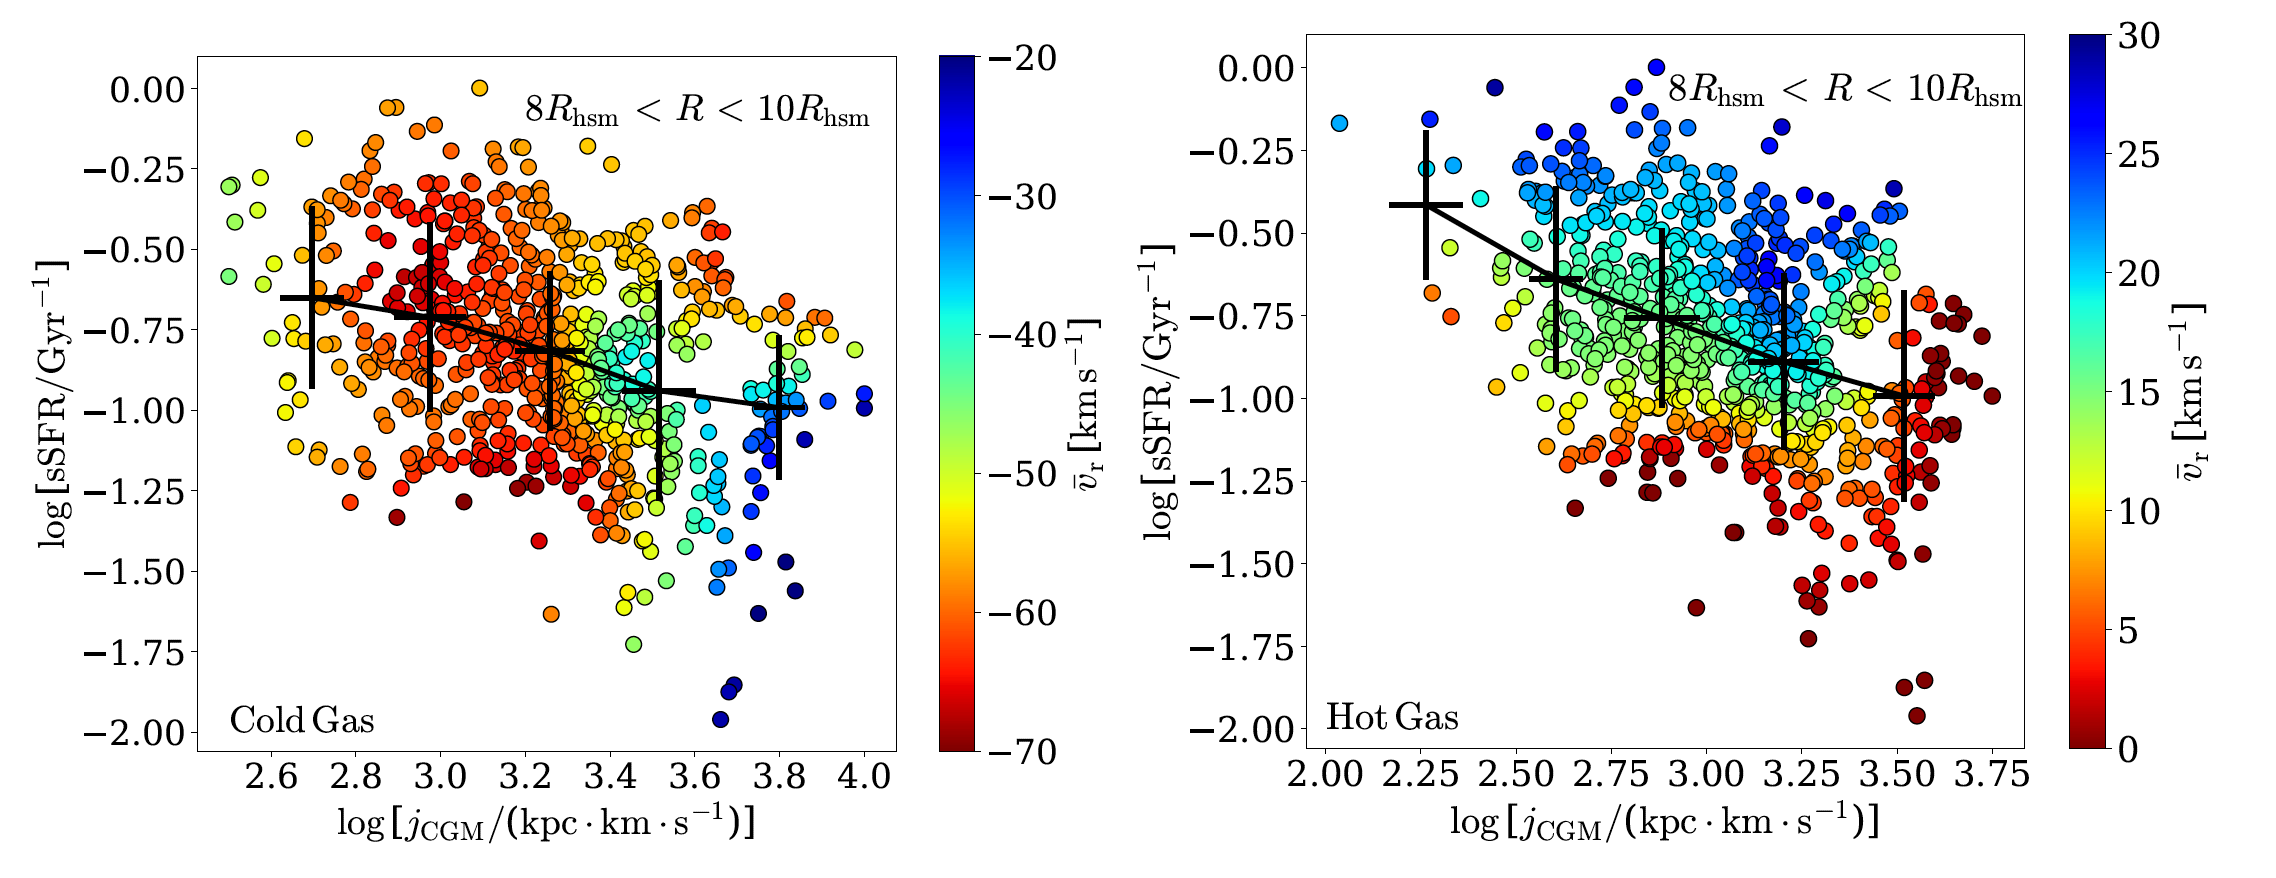
In this paper, we use star-forming disk samples from IllustrisTNG-100 simulation to study the interconnections between a galaxy’s star formation, the circumgalactic gas motion and the large-scale environment. We divide the CGM gas into a cold phase (from 1e4 K to 2e4 K) and a hot phase (higher than 1e5 K). The motions of these phases are totally different, with cold phase displaying tangentially inwards motion (in-spiral) and hot phase exhibiting radially out-going motion. Both hot and cold phases receive angular momentum modulations from the large-scale environment and regulations from feedback, but they show different responses as is shown in the figure above: the lower the angular momentum of the cold gas, the faster it inflows into the galaxy, triggering stronger star formation activity; the more active star formation is, the faster the hot gas flows outwards, serving as a resistance to the inflowing cold CGM.
We find that the interactions (mergers and fly-bys) with the large-scale environment are often responsible for triggering new star formation episodes in the galaxy center. A crucial condition for the episodic star formation relies on a galaxy’s large-scale environment, where galaxy mergers and fly-by interactions continuously provide effective channels to send low angular momentum cold gas from large scales down to small radii inside the galaxy. This supplement of the low angular momentum cold gas will light up the star formation activity and also the feedback. Strong feedback will then prevent the further build-up of the gas reservoir. When the gas reservoir of a galaxy is consumed, the galaxy will step into a quiescent state, the weakened feedback will allow the low angular momentum cold gas to flow in -- a new star formation episode then starts. By repeating the process above, our star-forming disk samples finally present episodic star formation histories. Such episodic star formation pattern is well synced with the “breathing in and out” motion of the CGM gas which receives angular momentum modulations from large-scale environment and the regulations from the feedback. As a result, a present day star-forming galaxy may have gone through multiple star-forming with quiescent cycles in between during its evolution. We propose that this signal can be extracted from spatially resolved stellar populations for Milky Way and nearby galaxies.
Wang, Sen; Dandan, Xu; Shengdong, Lu; Zheng, Cai; Maosheng, Xiang; Shude, Mao; Volker, Springel; Lars, Hernquist
Monthly Notices of the Royal Astronomical Society, 2022, Volume 509, Issue 3, pp.3148-3162
[ArXiv]
We make use of the advanced magneto-hydrodynamic cosmological galaxy formation simulation, the IllustrisTNG Simulation to study the connection among the environment, the ambient CGM gas around galaxies and the star-formation/quenching activities inside galaxies. We show that the influence exerted by the large-scale galaxy environment on the CGM gas angular momentum results in either enhanced (Paper I) or suppressed (Paper II, this paper) star formation inside a galaxy. The present-day quenched early-type galaxies are seen to have higher CGM angular momentum, which is inherited from their high environmental angular momentum, resulting in less efficient gas inflow into the central star-forming gas reservoirs. Thus, they will keep the quenched status once they are quenched. As a comparison, however, the present-day star-forming disk galaxies may have experienced multiple star-forming and quenched epochs due to the "fight" between the CGM gas inflow (due to their relatively low angular momentum) and the AGN activities (Paper I).
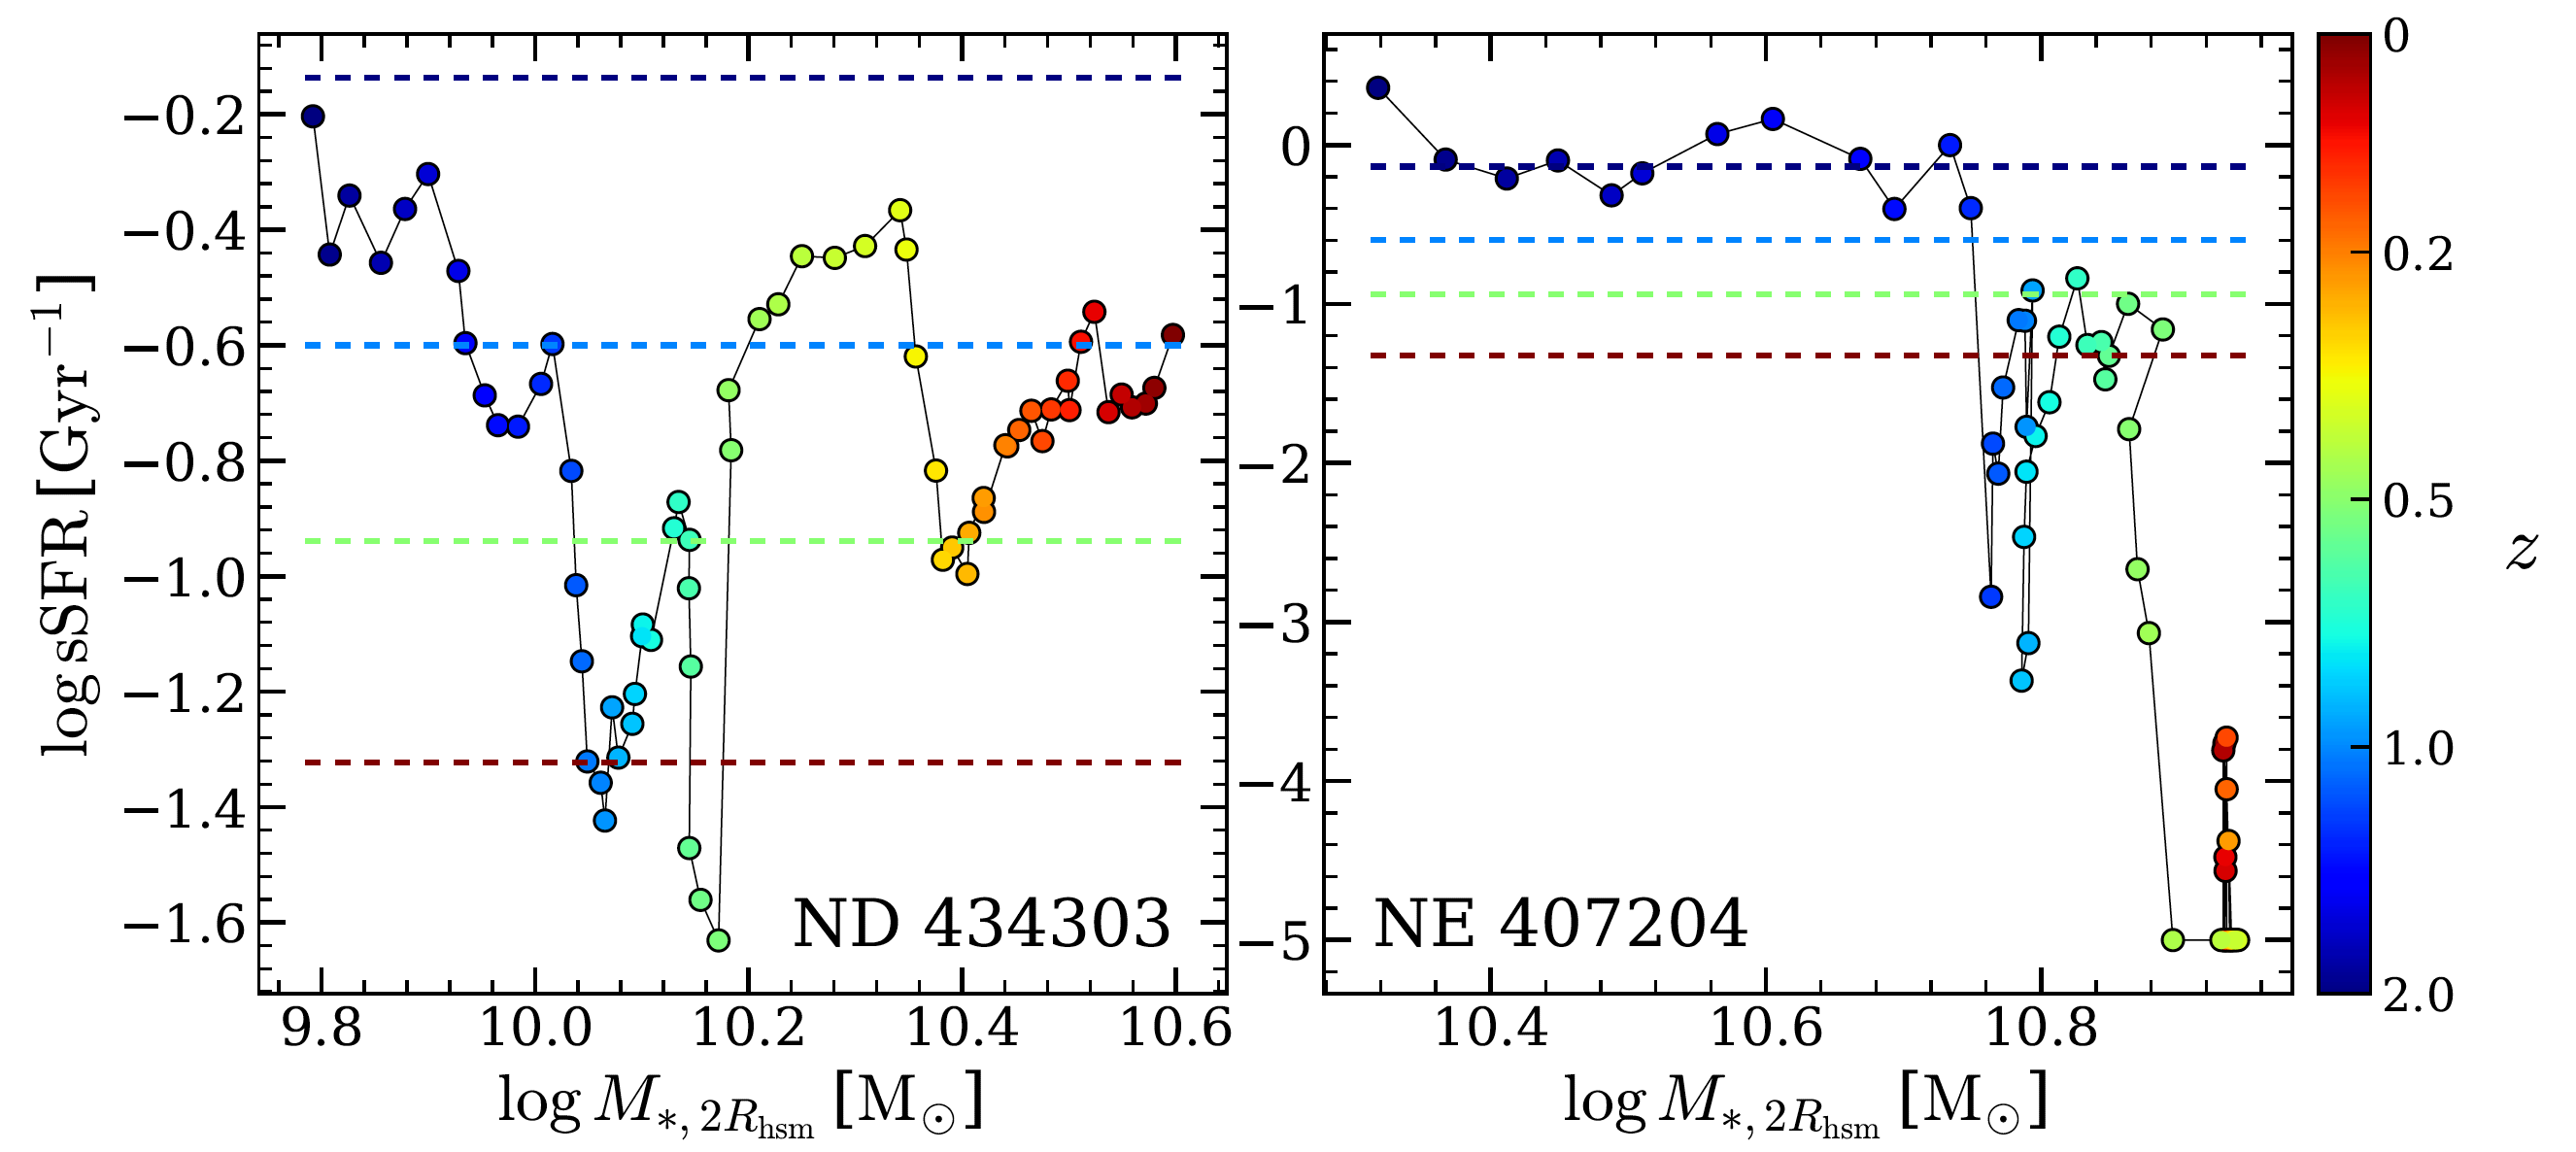
As a hint, we show the evolution tracks on the sSFR-stellar mass plane of a present-day star-forming disk galaxy (Galaxy ID: 434303, left) and a present-day quenched elliptical galaxy (Galaxy ID: 407204, right). In each panel, the four dashed lines from top to bottom indicate the lower boundary in log sSFR for the main sequence galaxies at z=2, 1, 0.5, and 0 (indicated by colors), below which galaxies are regarded as quenched. The lower boundary is calculated as the 16th percentile of the sSFR for the galaxies with stellar masses between 3E9 to 3E10 solar masses at different redshifts.
For the example present-day star-forming disk (left), it has experienced multiple star-forming episodes, interrupted by quenched phases, most noticeably at z~1 and z~0.5, where the sSFR drops significantly below a certain star-forming threshold and the central gas fraction drops to below 5%. During these quenched phases, this system shows a deficit of cold and lower-angular momentum CGM gas. Luckily, each time a new episode of star formation manages to come back (once the feedback from the previous generation weakens) thanks to the resupply of lower-angular momentum CGM gas, as a perturbative consequence of galaxy interaction. In comparison, the present-day quenched early-type galaxy (right) was not that "lucky". It was once an active star-forming galaxy before z~2 and then became quenched and has remained quenched ever since, as indicated by a sudden drop of nearly three orders of magnitude in sSFR around z~1.
Shengdong, Lu; Dandan, Xu; Sen, Wang; Zheng, Cai; Chuang, He; C. Kevin, Xu; Xiaoyang, Xia; Shude, Mao; Volker, Springel; Lars, Hernquist
Monthly Notices of the Royal Astronomical Society, 2022, Volume 509, Issue 2, pp.2707-2719
[ArXiv]
Galaxy morphologies, kinematics, and stellar populations are thought to be linked to each other. However, both simulations and observations have pointed out mismatches therein. In this work, we study the nature and origin of the present-day quenched, bulge-dominated, but dynamically cold galaxies in the IllustrisTNG-100 simulation. We compare these galaxies with a population of normal star-forming dynamically cold disc galaxies and a population of normal quenched dynamically hot elliptical galaxies within the same mass range. The populations of the present-day quenched and bulge-dominated galaxies (both being dynamically cold and hot) used to have significantly higher star formation rates and flatter morphologies at redshift of z~2. They have experienced more frequent larger mass-ratio mergers below z~0.7 in comparison to their star-forming disc counterparts, which is responsible for the formation of their bulge-dominated morphologies. The dynamically cold populations (both being star forming and quenched) have experienced more frequent prograde and tangential mergers especially below z~1, in contrast to the dynamically hot ellipticals, which have had more retrograde and radial mergers. Such different merging histories can well explain the differences on the cold and hot dynamical status among these galaxies. We point out that the real-world counterparts of these dynamically cold and hot bulge-dominated quenched populations are the fast- and slow-rotating early-type galaxies, respectively, as seen in observations and hence reveal the different evolution paths of these two distinct populations of early-type galaxies.
Lu, Shengdong; Xu, Dandan; Wang, Sen; Wang, Yunchong; Mao, Shude; Xia, Xiaoyang; Vogelsberger, Mark; and Hernquist, Lars
Monthly Notices of the Royal Astronomical Society, 2022, Volume 509, Issue 4, pp.5062-5074
[ArXiv]
A key feature of a large population of low-mass, late-type disc galaxies are star-forming discs with exponential light distributions. They are typically also associated with thin and flat morphologies, blue colours, and dynamically cold stars moving along circular orbits within co-planar thin gas discs. However, the latter features do not necessarily always imply the former, in fact, a variety of different kinematic configurations do exist. In this work, we use the cosmological hydrodynamical IllustrisTNG simulation to study the nature and origin of dynamically hot, sometimes even counter-rotating, star-forming disc galaxies in the lower stellar mass range. We find that being dynamically hot arises in most cases as an induced transient state, for example due to galaxy interactions and merger activities, rather than as an age-dependent evolutionary phase of star-forming disc galaxies. The dynamically hot but still actively star-forming discs show a common feature of hosting kinematically misaligned gas and stellar discs, and centrally concentrated on-going star formation. The former is often accompanied by disturbed gas morphologies, while the latter is reflected in low gas and stellar spins in comparison to their dynamically cold, normal disc counterparts. Interestingly, observed galaxies from MaNGA with kinematic misalignment between gas and stars show remarkably similar general properties as the IllustrisTNG galaxies, and therefore are plausible real-world counterparts. In turn, this allows us to make predictions for the stellar orbits and gas properties of these misaligned galaxies.
Lu, Shengdong; Xu, Dandan; Wang, Yunchong; Chen, Yanmei; Zhu, Ling; Mao, Shude; Springel, Volker; Wang, Jing; Vogelsberger, Mark; and Hernquist, Lars
Monthly Notices of the Royal Astronomical Society, 2021, Volume 503, Issue 1, pp.726-742
[ArXiv]
Listen to Bruce Lee:
Fear comes from uncertainty; we can eliminate the fear within us when we know ourselves better.
Do not pray for an easy life, pray for the strength to endure a difficult one.
If you always put limit on everything you do, physical or anything else, it will spread into your work and into your life. There are no limits. There are only plateaus. You must not stay there. You must go beyond them.
Magic Beans at TAGLAB
Dr. Dandan Xu is a happy kid. She is a detective on galaxy evolution. She likes eating, so far so good. She wants to understand gravity and she will.
Email: dandanxu AT tsinghua DOT edu DOT cn
Ms. Jiaqi Liu is the keeper of the group. Watering the beans and taking them out for sunshine everyday is her job. She is as bright as the sunshine of a sunny day.
Email: jiaqiliu AT tsinghua DOT edu DOT cn
Hi ya! I am Hongming Tang, a post-doctoral researcher and a SCA lisenced coffee cupper. I am working on deep learning applications upon the study of radio galaxy, galaxy dynamics and coffee trees. Besides, I am the Zooniverse project lead of a in prep. citizen science project - Radio Galaxy Zoo: EMU and a co-author of Springer book in prep. named "Data Intensive Radio Astronomy: Bring Astrophysics to Extabyte Era". Please feel free to chat with me if you are interested in science, outreach, cats (my little cat named mooncake) or coffee :)
Hi! I am ZHANG Yuning, a postdoc researcher at DoA. I devote myself to basic scientific research. My research fields include but not limited to X-ray astronomy, large-scale structures, and particle detection technology.
Hi! I am Rui Xu, currently a postdoc at the Department of Astronomy, Tsinghua University. I obtained a BS degree of Astronomy from Nanjing University and a PhD degree of Physics from Indiana University Bloomington. My research focuses on gravitational theories and their implications to observations. I am particularly interested in testing the fundamental principles in general relativity and its alternatives through pulsar and gravitational-wave observations.
Hi, I am Sen Wang, a graduate student at Department of Astronomy, Tsinghua University. I took my bachelor degree at the Institute of Physics and Technology, Wuhan University. My research interests include the galaxy formation and evolution, cosmology, dark matter ,and theories of gravity. I am now focusing on understanding the interconnections between the large-scale environment, circum-galactic medium and the galaxy star-formation activity. In my spare time, I like swimming and playing basketball, but I always fail to lose my weight.
Hi, I am Yan Liang, a graduate student at the Department of Astronomy, Tsinghua University. I got my bachelor degree of nuclear physics in Beijing University of Aeronautics and Astronautics (BUAA). I was born in Wuwei of Gansu province near the Qilian mountains where the local attractional foods like NiangPi and Troika are highly recommended. My research interests are strong gravitational lensing and galactic dynamics. Currently I focus on the degeneracy of fraction between dark matter and baryonic matter in the strong lensing systems, which may interfere our understanding of the physical processes in the evolution of galaxies. In my spare time, I will play the Gwent card, search the delicious foods, read and discuss history with my friends.
Hi, I am Jiani Chu, a PhD student at the Department of Astronomy, Tsinghua University. My research interests include galaxy evolution, machine learning, and numerical simulation.
Hello everyone, I am Wenshuo, a PhD student at the Department of Astronomy. I come from Linyi, Shandong province, which is famous for the Mount. Yimeng and the specialty pancake. My current research is on the differential lensing effect. This effect is caused by the differential magnification of strong lensing for extended sources. We are trying to figure out how strongly this effect can bias our analysis on the source galaxies, such as the spectral and mechanical properties, and eliminate it through the reconstruction of lensing system. Besides the astronomy, I’m greatly interested in various art pieces (but know nothing about painting). Museums and galleries are my favorite places. Also, I like swimming, but not good at it. I like traveling, but just for eating delicious food. Anyway, life is hard, but I’m trying to make it easy!
Hi! I am Ruizhe Feng, a graduate student at the Department of Astronomy, Tsinghua University. Previously I was an undergraduate majoring in physics at Department of Physics, Tsinghua University. I was born in Cangzhou of Hebei province and grew up in Tianjin, where the traditional food Jianbing Guozi and fried dough twist are very famous and delicious. My research interests include gravitational lensing and dark matter. Recently my research has been focused on the flux ratio anomaly problem in strong lensing, which is the phenomenon that in multiply-imaged lens systems simple lens model can reproduce image positions quite well but cannot reproduce relative flux ratios. Its origin is still an unsolved problem.
Hello, fellow cosmic explorers! I am Xincheng Zhu, a graduate student at Department of Astronomy, Tsinghua University, diving deep into the mysteries of the connection between large-scale structures and galaxy formation. In my spare time, I like swimming, playing the piano and also playing some mobile games like Genshin Impact and Honkai series. Whether or not you share my enthusiasm for my research area, as long as we both have a passion for astronomy, sports, music or video games, we can become great friends. Do not hesitate to reach out!
Hi! I am Yuqian Gui, an undergraduate student at Zhili College, Tsinghua University, majoring in physics. I was born in Chizhou, Anhui province, which is a little beautiful city with picturesque natural sceneries. Recently I am studying how large-scale structure affects galaxy evolution through circumgalactic gas angular momentum. Running is my favorite sport, but I am also glad to do other sports sometimes, like swimming, diving, cycling, etc. I would like to go out for photographing or watch a movie when available, which would drag me out of my daily busy life! :)
Dr. Shengdong Lu former postdoc at TAGLAB, hard-working and very kind.
Mr. Yiru Chen former unergraduate student, hard-working, lovely and kind.
Mr. Hongshan Liu former undergraduate student, highly intelligent.