Stars and Planets
—Light—
Chris Ormel

Roadmap module 3
Physics of Light
Light is electromagnetic radiation, which comes in discrete energy packets (photons)
- blackbody (Planck) spectrum
- M4. Equation of State
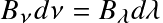
Light and Distances in Astronomy
Understand how astronomers measure distances to and brigtness of objects
- absolute and apparent magnitudes
- parallax
- color
(collisional) ionization and excitation
Boltmann (excitation) and Saha (inonization) equations together determine the level populations of energy states
Transitions
The change of an atom or molecule to a different energy state, which can result in the formation of a spectral line
(atomic) hydrogen spectrum
Lyman, Balmer, Paschen, ... series
Stellar classification
characterize stars by their spectrum. O, B, A, F, G, K, M
Hertzsprung Russell (HR) diagram
(Also: color-magnitude diagram). Understand the basics of the most famous diagram in Astronomy; locate the positions of stars on the HR diagram.
Saha equation
- electronic transitions
- vibrational transitions
- molecular transitions
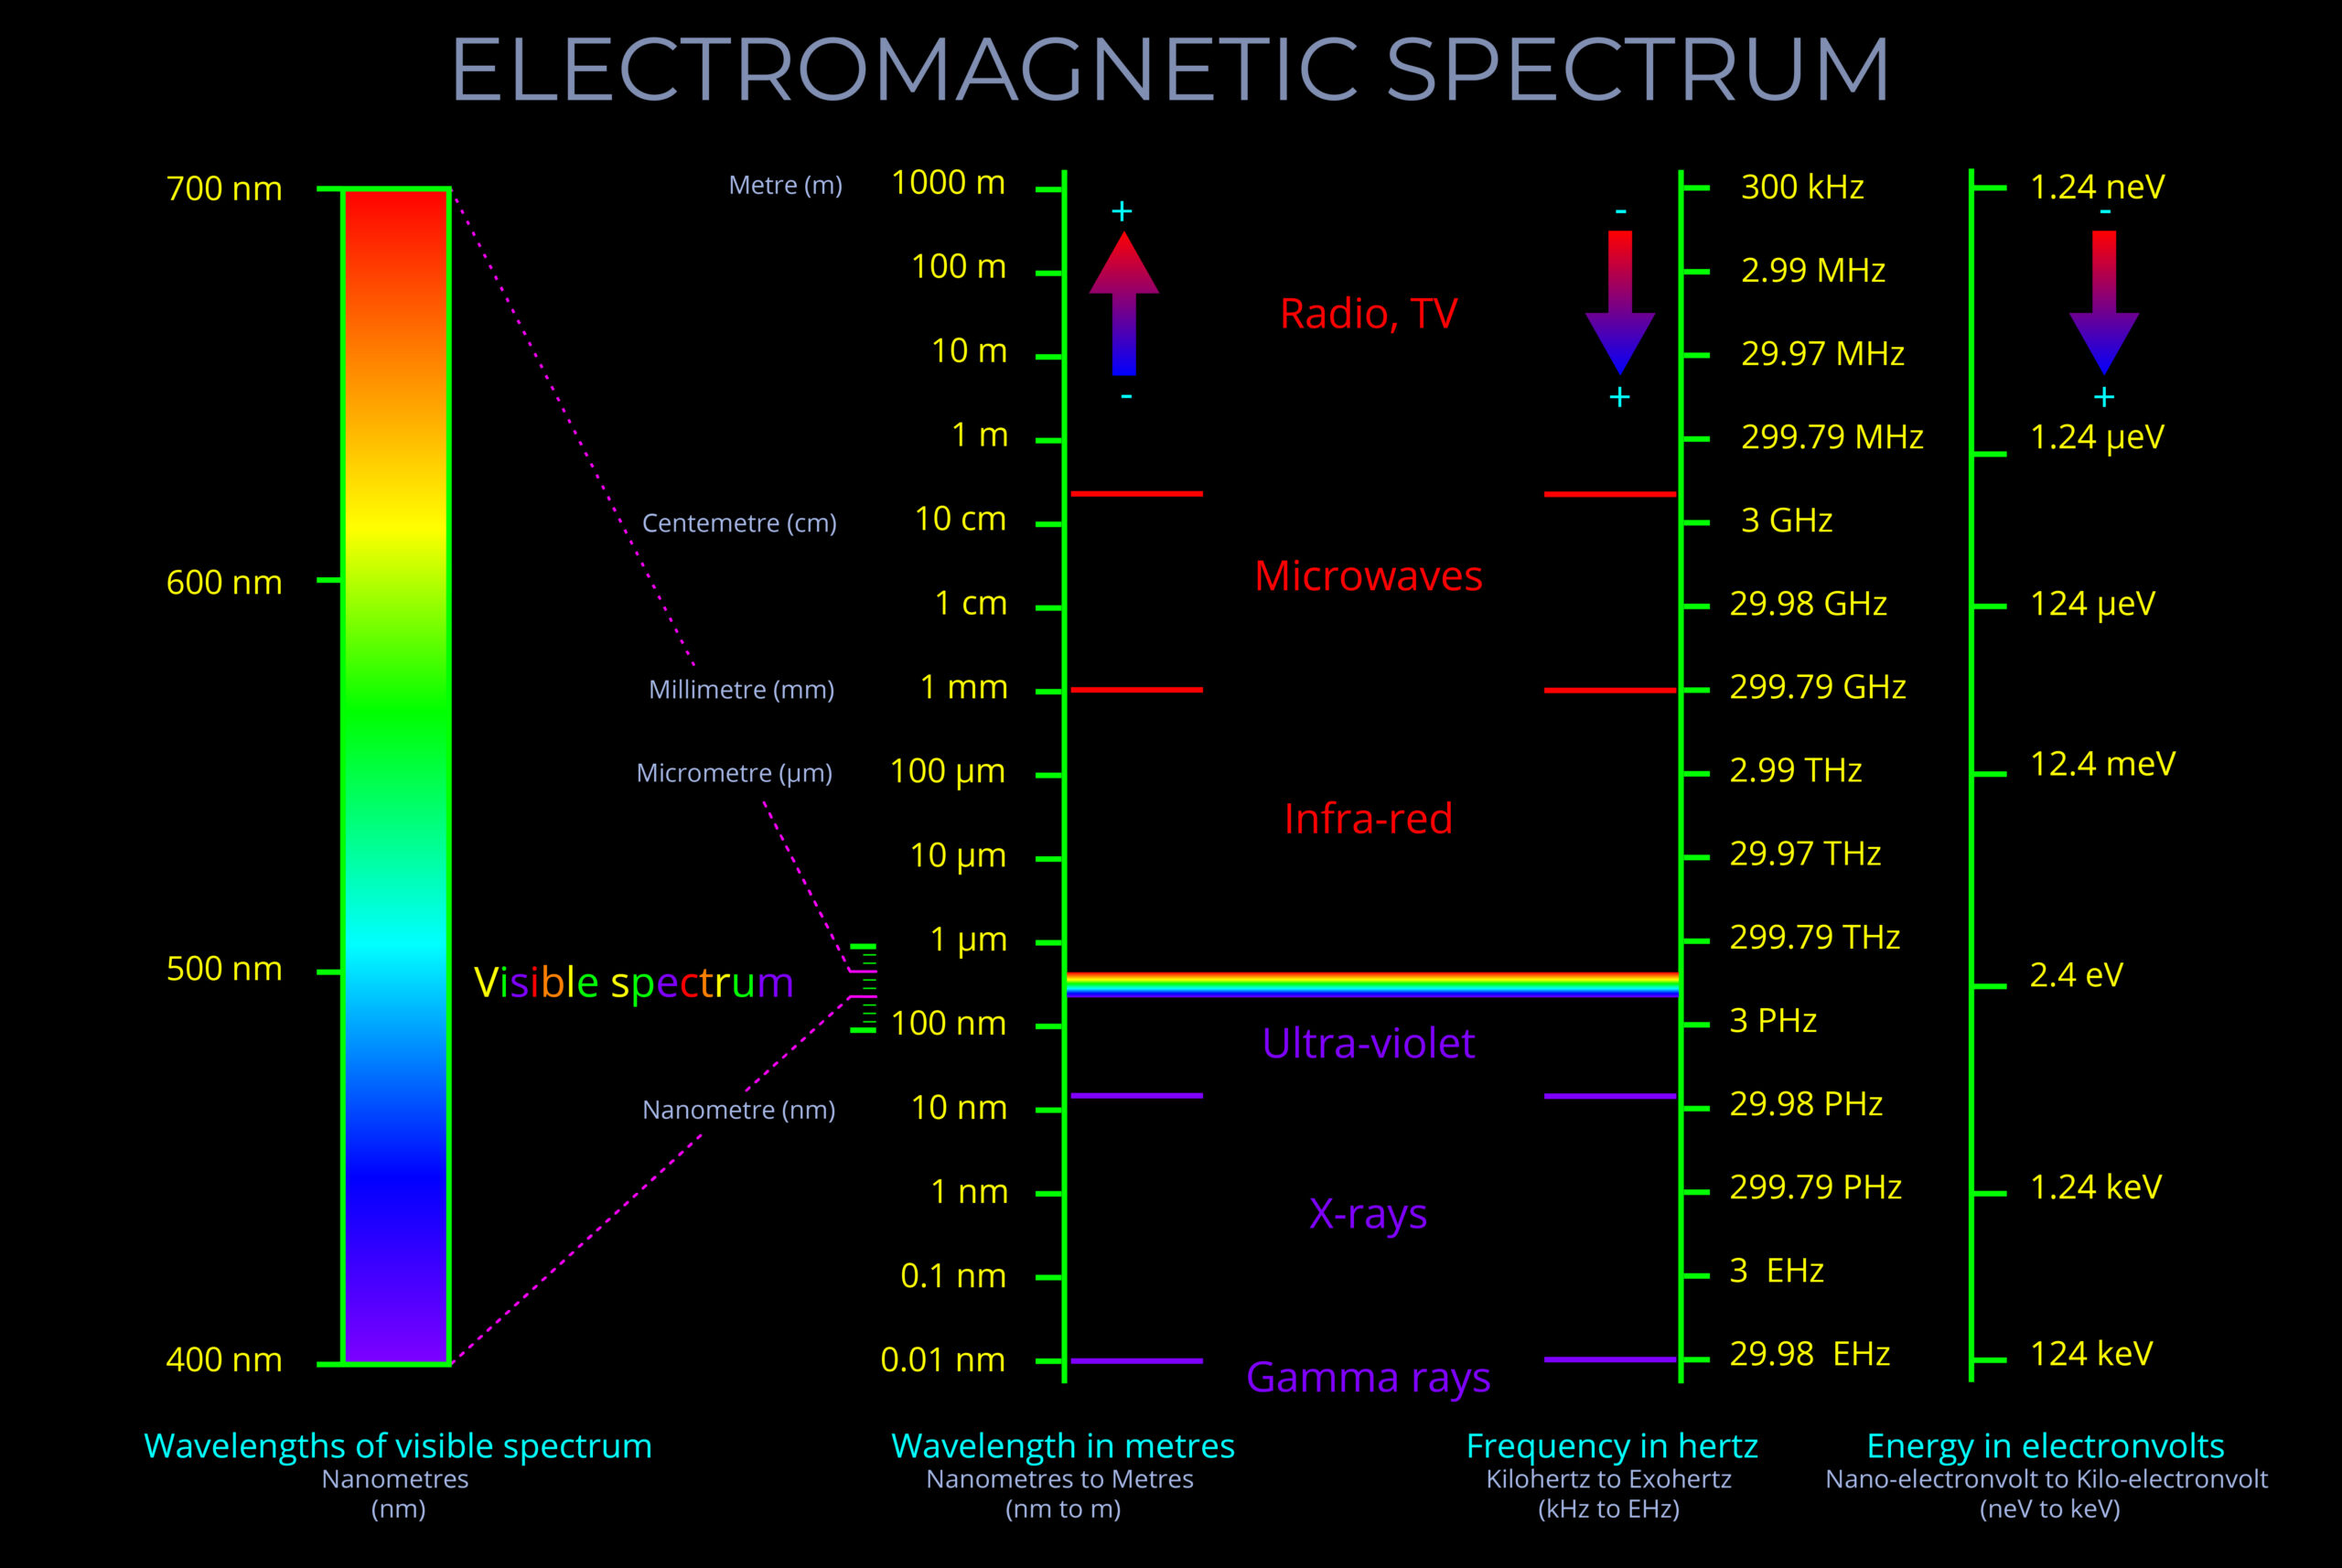
Electromagnetic spectrum

Radio continuum
Synchroton emission (fast electrons)
Cas(iopeia) A
supernovae remnant
Electromagnetic spectrum
Atomic hydrogen
Electromagnetic spectrum
Radio continuum
synchroton emission (fast electrons) and free-free emission (hot ionized regions)
Electromagnetic spectrum
J1→0 CO line
molecular gas and star formation regions
Electromagnetic spectrum
far-IR continuum
re-radiated thermal emission (warm dust)
Electromagnetic spectrum
mid-IR continuum
diffuse PAH emission and point source (RGB, planetary nebula, SF-regions)
Electromagnetic spectrum
near-IR
cool K-stars (some absorption by dust)
Electromagnetic spectrum
optical
stars (much absorption by dust)
Electromagnetic spectrum
X-rays
collisions by cosmic rays and pulsars
Electromagnetic spectrum
gamma rays
collisions by cosmic rays and pulsars
Crab Pulsar
Light
- Radiation energy density
- Planck function
- Stefan-Boltzmann law
- Magnitudes
Radiation
read CO 3.4-3.6 and CO 9.1
A photon gas obeys Bose-Einstein statistics, the spectral energy density is
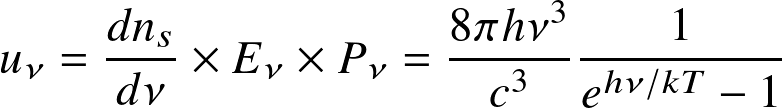
that is, the product of the density of states, the energy, and the probability that it is occupied. where
 is frequency,
 is Planck's constant,
 temperature, c the speed of light, and k Boltzmann constant. The derivation follows from statistical mechanics principles.
Note: In astronomical nomenclature the subscript notation of frequency or wavelength (e.g.,
 ,
,
 ,
,
 ) typically indicates a spectrum!
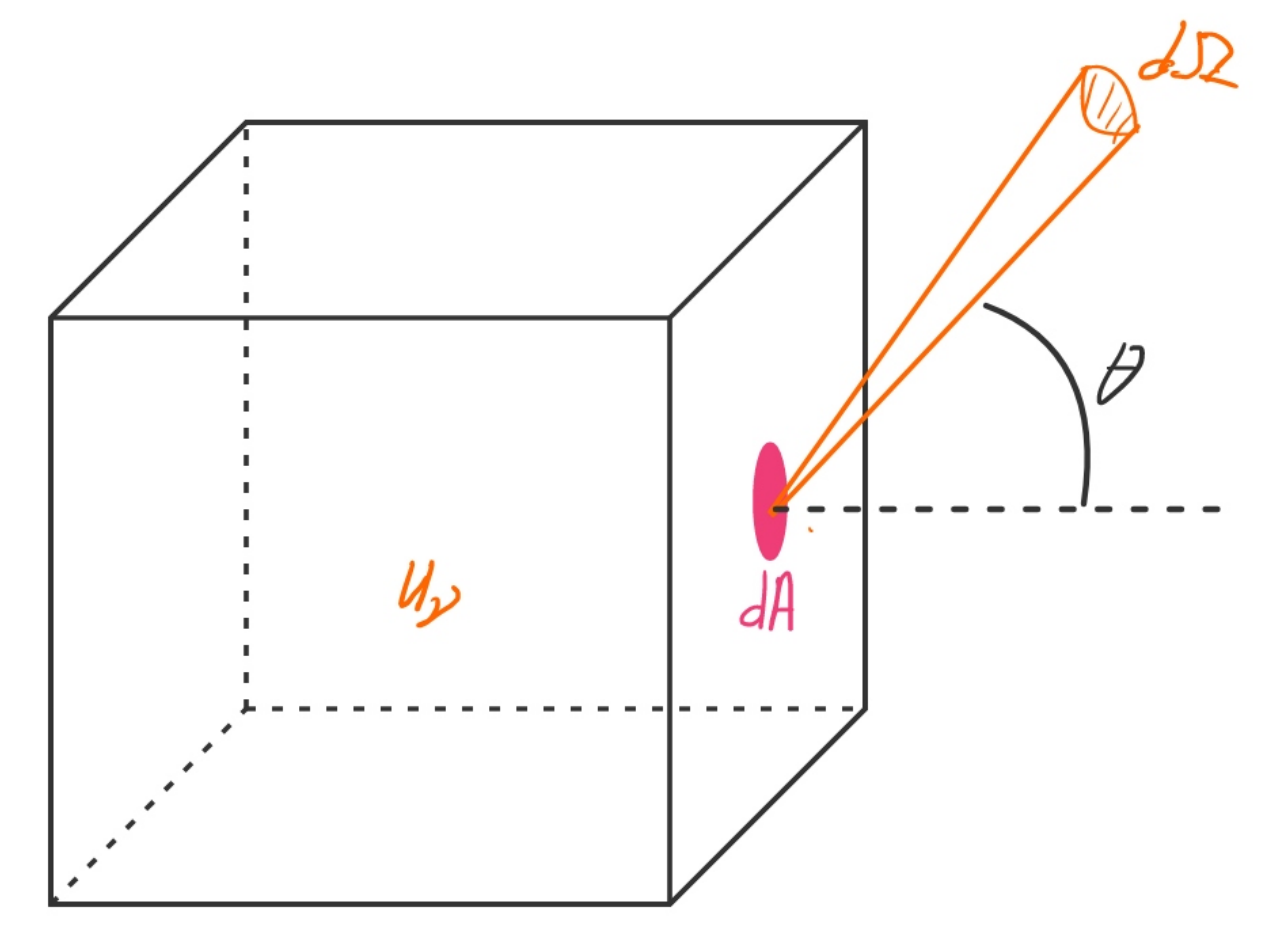
the spectral intensity with which the energy escapes to space is :
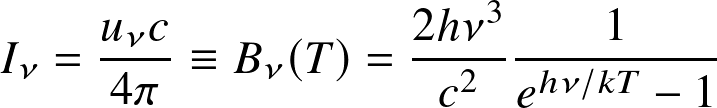
This is the Planck function ( black-body radiation ): the amount of energy radiated per unit area, per unit frequency, per unit solid angle (spatial angle)
 and intensity
 .
The latter is defined as the energy traveling through an area dA per unit time per unit solid angle
.
The latter is defined as the energy traveling through an area dA per unit time per unit solid angle
 in a certain direction.
Radiation
read CO 3.4-3.6 and CO 9.1
Integrated over frequency, we obtain:
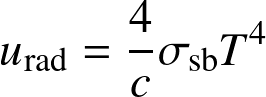
- The total photon energy density:
![]()
where
![]() is Stefan-Boltmann constant.
is Stefan-Boltmann constant.
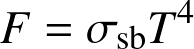
- The radiated power per unit area
![]()
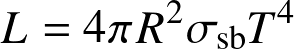
- The total power radiated by a spherical body
(Stefan-Boltzmann law)
![]()
where L is luminosity and R the radius.
It is customary to define the effective temperature![]() in this way:
in this way:
![]()
even when the radiation does not follow a blackbody.


Radiation
read CO 3.4-3.6 and CO 9.1
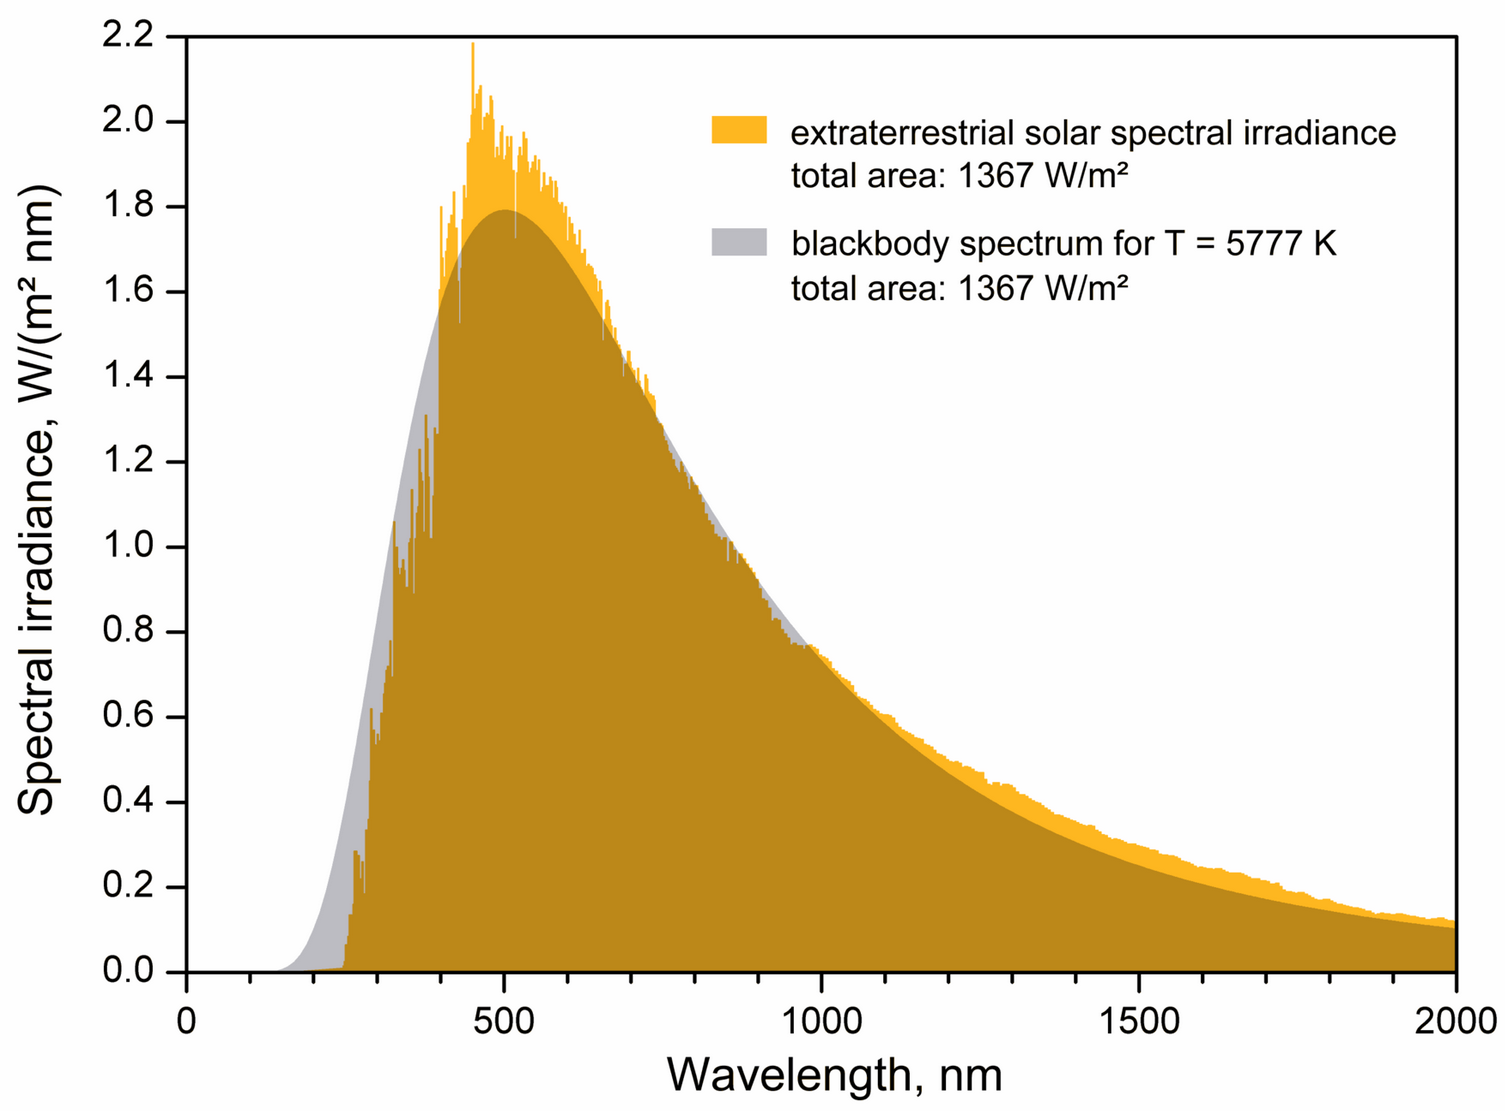
Properties Planck function

- The peak of the blackbody spectrum shifts to shorter wavelength for hotter blackbodies. It is known as
Wien's displacement law:
![]()
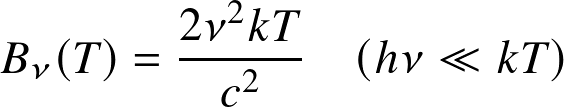
- Rayleigh-Jeans law at long wavelengths:
![]()
- Wien's approximation at high frequencies

 as function of wavelength. The dotted line follows the peak of the energy spectrum
The relation
as function of wavelength. The dotted line follows the peak of the energy spectrum
The relation
 can be used
to convert
can be used
to convert
 into
into
 .
.
Magnitudes
In astronomy we often express brightness on a logarithmic —magnitude— scale
- magnitudes are always defined relative to a reference flux:
![]()
Brighter stars have lower magnitude! The key significance of magnitude lies in its relative scaling, not in the absolute value
![]() .
Often the star Vega — or rather the emission corresponding to an 11,000 K blackbody — is used for the reference magnitude
.
Often the star Vega — or rather the emission corresponding to an 11,000 K blackbody — is used for the reference magnitude
Or, between two stars a difference in flux amounts to a different in magnitude of
![]()
where
![]() is
the magnitude of star 1,
is
the magnitude of star 1,
![]() the magnitude
of star 2,
the magnitude
of star 2,
![]() the brightness
of star 1,
the brightness
of star 1,
![]() the brightness of star 2.
the brightness of star 2.
Stars that differ by a factor 100 in brightness, differ by 5 magnitudes with the brightest star having the lowest value!


Magnitudes
In astronomy we often express brightness on a logarithmic —magnitude— scale
- magnitudes are always defined relative to a reference flux:
![]()
- Absolute (intrinsic) and apparent magnitudes:
- absolute magnitude M expresses the brightness of a star as seen from a distance of 10 pc
- apparent magnitude m expresses the brightness as we see it from Earth
![]()
where m-M is called the distance modulus


Magnitudes
In astronomy we often express brightness on a logarithmic —magnitude— scale
- magnitudes are always defined relative to a reference flux:
![]()
- Absolute (intrinsic) and apparent magnitudes:
![]()
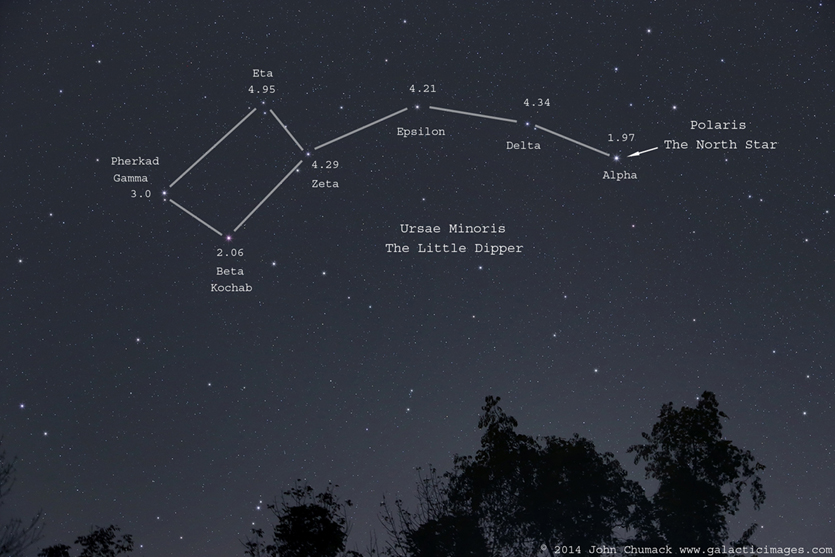
- A difference in magnitudes between two wavelengths filters, is called a
color:
![]()


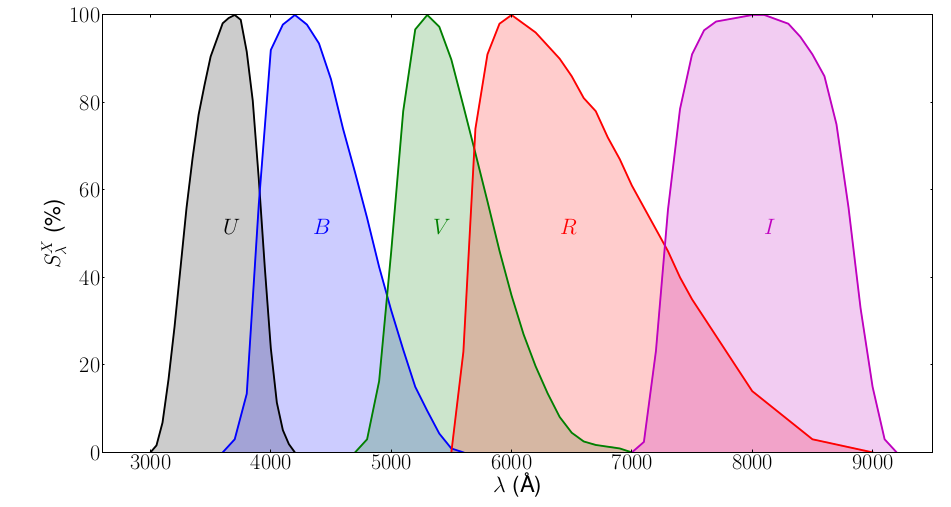
Hertzsprung-Russell (HR) diagram
Arguably the most important diagnostic tool in Astronomy! One identifies:
- Main-sequence (MS): diagonal line; increase for stars with different mass
MS-stars are stars that fuse hydrogen into helium
- Red giant branch (RGB)
Stars ascend it after H-burning stops in the core
- Supergiant branch
Massive stars that have left the MS
- White Dwarf branch
"Dead" remnant of stellar cores
- Hayashi track
nearly vertical line in HR-diagram; stars (in equilibrium) cannot cross it
Note: In all HR-diagrams (or its observational equivalent, the color-magnitude diagram ) brigh(ter) stars can be found at the top, while red(der) stars are at the right.
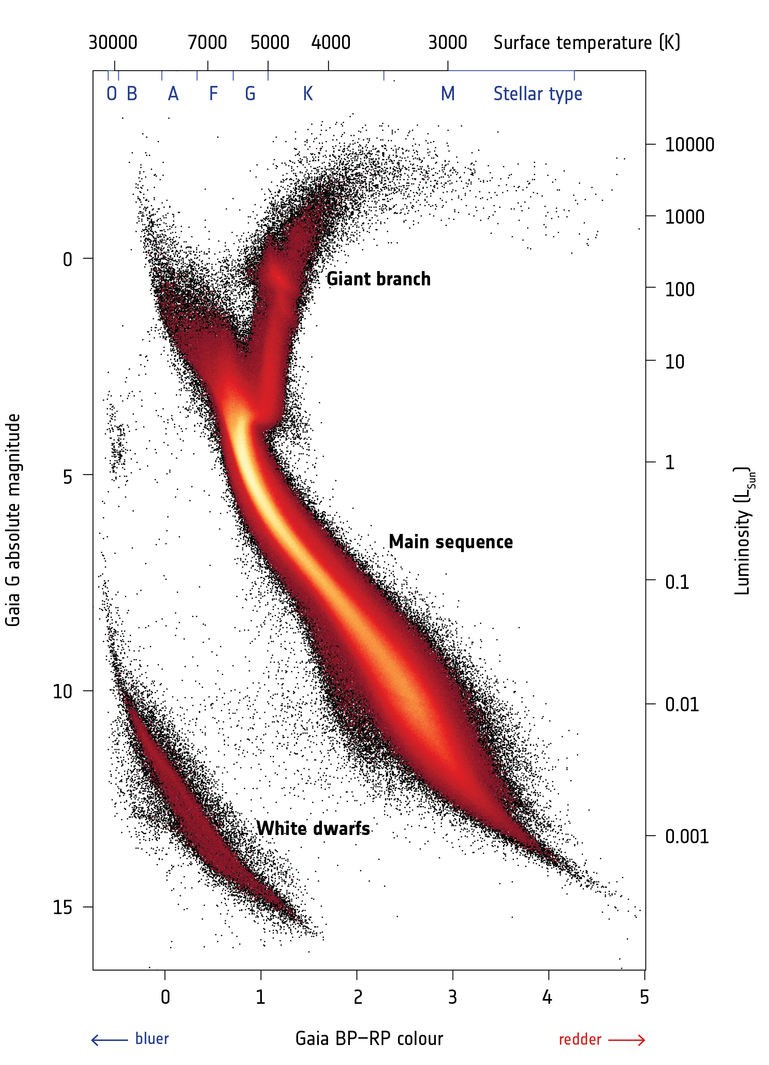
Color-magnitude diagram (CMD)
Note: In all HR-diagrams (or its observational equivalent, the color-magnitude diagram ) brigh(ter) stars can be found at the top, while red(der) stars are at the right.
← Example of a color-magnitude diagram from the GAIA satellite ↓, plotting absolute magnitude vs color.
Transitions
- Bohr's semi-classical H model
- Saha equation
Transitions
read CO Ch. 8.1
-
Electronic.
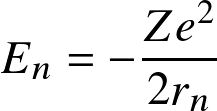
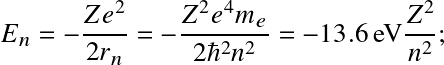
Following Bohr's classical atomic model, energy levels for the electron are discretized as
![]()
where
![]() with
with
![]() the
Bohr radius.
This correspond to energy levels
the
Bohr radius.
This correspond to energy levels
![]() with transitions occurring at near-UV/visible wavelengths.
with transitions occurring at near-UV/visible wavelengths.


-
Vibrational.
Energy levels are
![]()
where v is the vibrational quantum number and the frequency is related to the bond force constant k (Hooke's law)
![]() . Energy levels a factor
. Energy levels a factor
![]() lower than electronic.
Lines appear at near-IR wavelengths
lower than electronic.
Lines appear at near-IR wavelengths
-
Rotational.
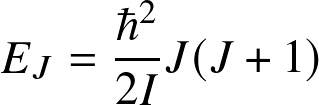
Energy levels are
![]()
(valid for a rigid rotating diatomic or linear molecule), where I is the moment of inertial and J is the rotational quantum number. Energy levels are lower by
![]() compared to electronic.
Transitions occur at (sub)millimeter wavelengths
compared to electronic.
Transitions occur at (sub)millimeter wavelengths


Transitions
read CO Ch. 8.1
-
Electronic.
Following Bohr's classical atomic model, energy levels for the electron are discretized as
![]()
where
![]() with
with
![]() the
Bohr radius.
This correspond to energy levels
the
Bohr radius.
This correspond to energy levels
![]() with transitions occurring at near-UV/visible wavelengths.
with transitions occurring at near-UV/visible wavelengths.


-
Vibrational.
Energy levels are
![]()
where v is the vibrational quantum number and the frequency is related to the bond force constant k (Hooke's law)
![]() . Energy levels a factor
. Energy levels a factor
![]() lower than electronic.
Lines appear at near-IR wavelengths
lower than electronic.
Lines appear at near-IR wavelengths
-
Rotational.
Energy levels are
![]()
(valid for a rigid rotating diatomic or linear molecule), where I is the moment of inertial and J is the rotational quantum number. Energy levels are lower by
![]() compared to electronic.
Transitions occur at (sub)millimeter wavelengths
compared to electronic.
Transitions occur at (sub)millimeter wavelengths


Transitions
The transition strength is determined by:
- the extent the upper level is populated; and
- the rate at which the excited state will decay by photon emission (Einstein-A)
(for an emission line).
-
Selection rules.
Not all transitions are allowed.
Dipole transitions require (i) a permanent dipole moment; and (ii)
![]() .
Symmetric molecules — notably H2 —
do not have a permanent dipole moment!
They can emit only through much weaker quadrapule transitions
.
Symmetric molecules — notably H2 —
do not have a permanent dipole moment!
They can emit only through much weaker quadrapule transitions
![]() .
In cold disk, the gas is molecular but H2 is essentially invisible
.
In cold disk, the gas is molecular but H2 is essentially invisible


Question:
How then do astronomers measure the mass of cold, molecular gas?

Transitions
The transition strength is determined by:
- the extent the upper level is populated; and
- the rate at which the excited state will decay by photon emission (Einstein-A)
(for an emission line).
-
Selection rules.
Not all transitions are allowed.
Dipole transitions require (i) a permanent dipole moment; and (ii)
![]() .
Symmetric molecules — notably H2 —
do not have a permanent dipole moment!
They can emit only through much weaker quadrapule transitions
.
Symmetric molecules — notably H2 —
do not have a permanent dipole moment!
They can emit only through much weaker quadrapule transitions
![]() .
In cold disk, the gas is molecular but H2 is essentially invisible
.
In cold disk, the gas is molecular but H2 is essentially invisible

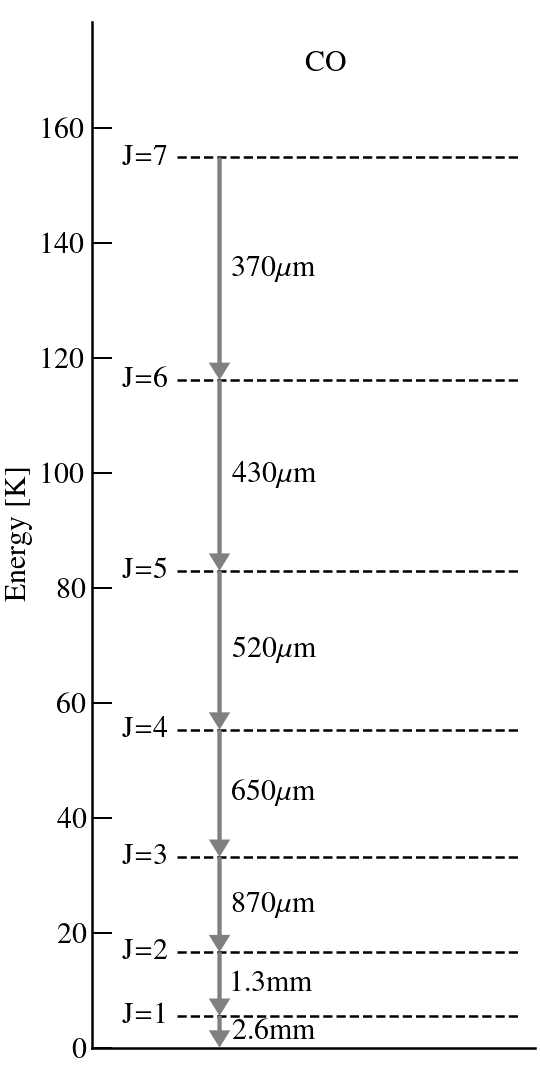
→ energy levels of the CO molecule. At high temperatures — e.g., room temperatures — all levels will be occupied. But at lower T — e.g., ~10 K for molecular clouds or the interior regions of protoplanetary disks — only the lowest J levels will be.
Given the level populations and the transition rates — the Einstein-A coefficient — the line strength can be calculated.
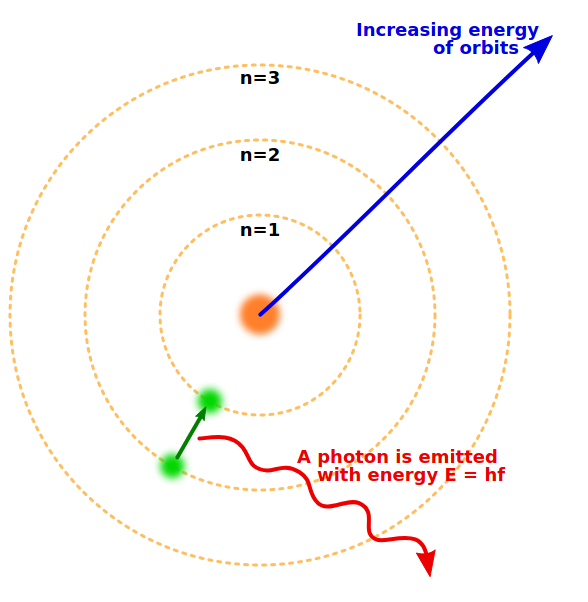
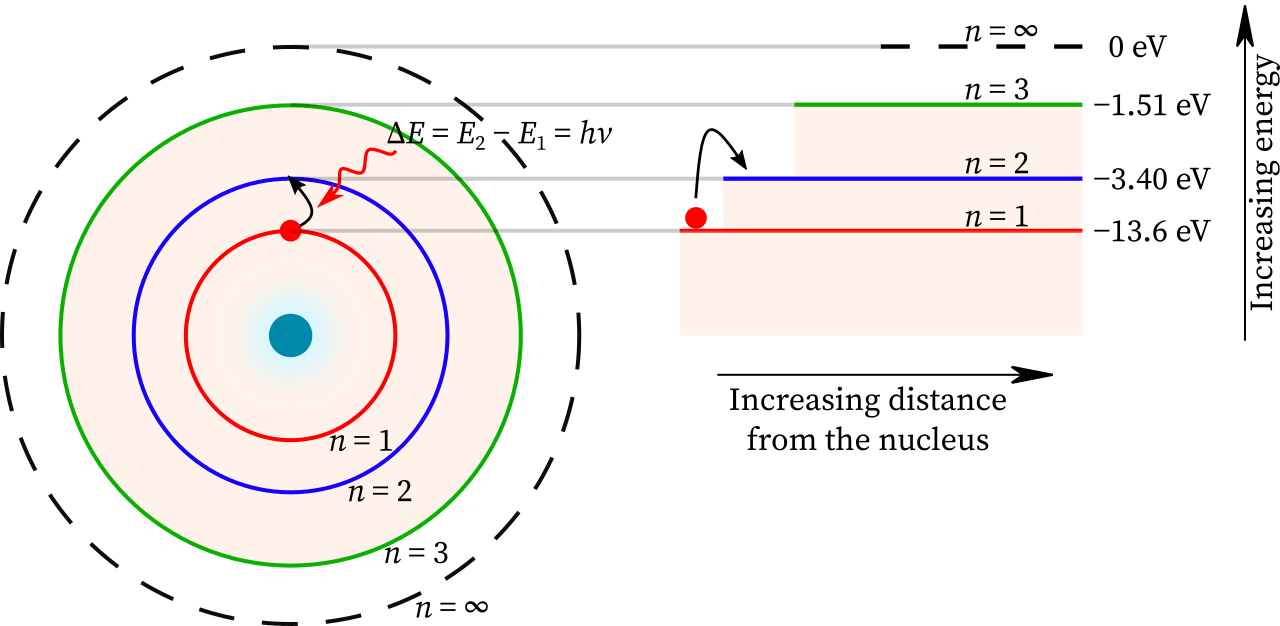
Electronic transitions/H-atom
- (semi-classical) Bohr atomic model
Bohr postulated that angular momentum of the electron is quantized in units of
![]() .
The corresponding energy levels are
.
The corresponding energy levels are
![]()

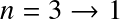
- For the hydrogen atom, the resulting transitions give rise to lines
- n=1: Lyman series. Transitions in UV
- n=2: Balmer series. Transitions at visible wavelengths
- The transition is further identified by a greek letter, α, β ...
For example
![]() for the
for the
![]() transition,
transition,
![]() for the
for the
![]() , etc.
, etc.
- In stellar atmospheres, these transitions appear in absorption


| name | abbr. | n | range λ [μm] |
|---|---|---|---|
| Lyman | Ly | 1 | 0.0912—0.122 |
| Balmer | Ba or H | 2 | 0.0365—0.656 |
| Paschen | Pa | 3 | 0.821—1.88 |
| Brackett | Br | 4 | 1.26—4.05 |
| Pfund | Pf | 5 | 2.28—7.46 |
| Humphreys | Hu | 6 | 3.28—12.4 |
Electronic transitions/H-atom
- (semi-classical) Bohr atomic model
Bohr postulated that angular momentum of the electron is quantized in units of
![]() .
The corresponding energy levels are
.
The corresponding energy levels are
![]()


- For the hydrogen atom, the resulting transitions give rise to lines
- n=1: Lyman series. Transitions in UV
- n=2: Balmer series. Transitions at visible wavelengths
- The transition is further identified by a greek letter, α, β ...
For example
![]() for the
for the
![]() transition,
transition,
![]() for the
for the
![]() , etc.
, etc.
- In stellar atmospheres, these transitions appear in absorption


Question:
Why in absorption?
ionization
read KW. Ch 14.1—2
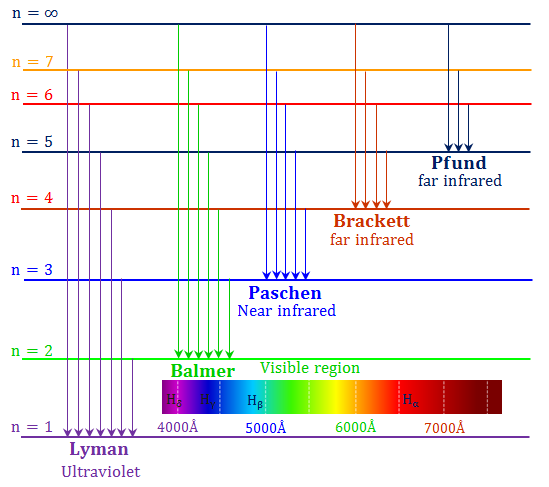
The Boltzmann equation determines the occupation levels within an ionization state
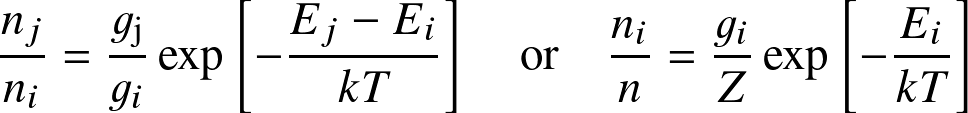
where Ei denotes the energy level with respect to the ground state (E1=0), gi the statistical weight, and Z the partition function:
ionization
read KW. Ch 14.1—2
The Boltzmann equation determines the occupation levels within an ionization state
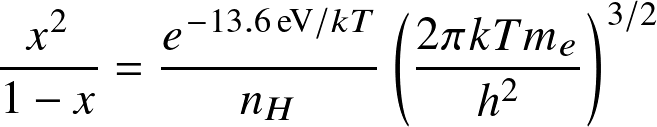
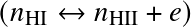
The Saha equation determines the occupation levels among ionization states:
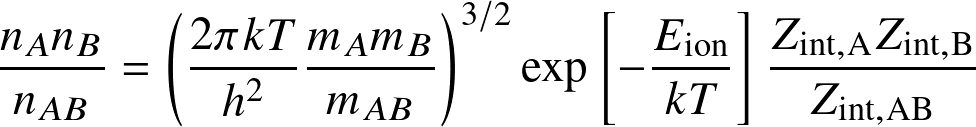
for the reaction
 where Eion is the ionization (or dissociation) energy, and the Zint are internal partition functions.
ionization
read KW. Ch 14.1—2
The Boltzmann equation determines the occupation levels within an ionization state
The Saha equation determines the occupation levels among ionization states:

for the reaction
 where Eion is the ionization (or dissociation) energy, and the Zint are internal partition functions.
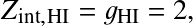
Applied to ionization of hydrogen
where Eion is the ionization (or dissociation) energy, and the Zint are internal partition functions.
Applied to ionization of hydrogen
 this reads:

where AB=HI, A=HII, B=e,
 ,
,
 ,
,
 and
and
 is known as the
ionization fraction
or
degree of ionization.
For the internal partition function of HI only the ground state is considered.
(Note. Accounting for the spin of the nucleus would increase both
is known as the
ionization fraction
or
degree of ionization.
For the internal partition function of HI only the ground state is considered.
(Note. Accounting for the spin of the nucleus would increase both
 and
and
 by a factor 2 but leave the equation unchanged.)
Question: Do we see Balmer lines in the Sun's atmosphere?
 was used for all T.
ionization
read KW. Ch 14.1—2
The Boltzmann equation determines the occupation levels within an ionization state
The Saha equation determines the occupation levels among ionization states:

Applied to ionization of hydrogen
 this reads:
Note that in Astronomy roman numericals indicate the ionization stage:
- (single roman) for neutral (e.g., HI = neutral hydrogen )
- (roman numeral 2) for singly ionized (e.g., HII = ionized hydrogen )
- (roman 3) for double-ionized (e.g., OIII is O2+)
- etc.
 was used for all T.
ionization
read KW. Ch 14.1—2
The Boltzmann equation determines the occupation levels within an ionization state
The Saha equation determines the occupation levels among ionization states:

Applied to ionization of hydrogen
 this reads:

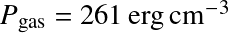
Pressure ionization becomes important at high densities
This occurs when
 with a0 the Bohr radius. Or
 Above these densities, everything is ionized.
 was used for all T.
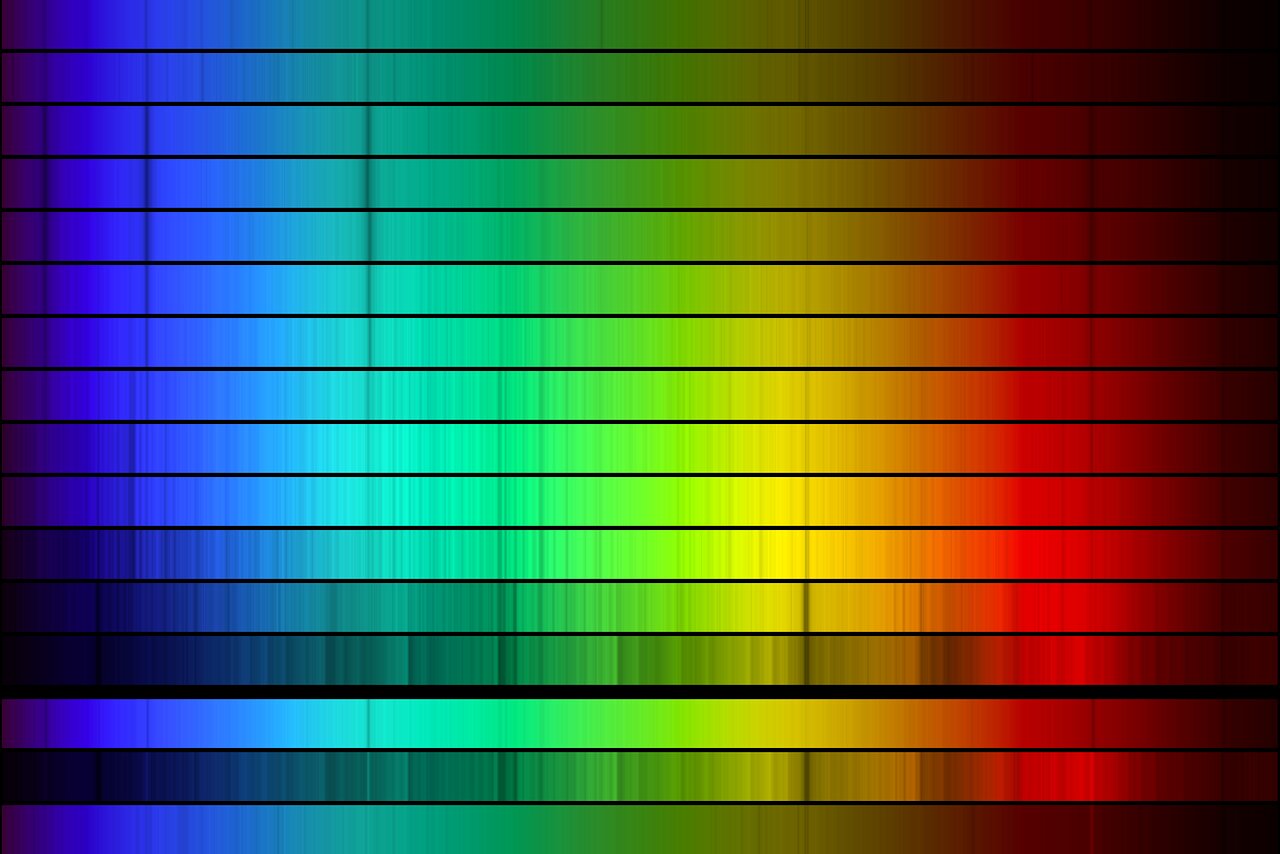
stellar classification
read CO Ch. 8
| Type | T(K) | Spectral lines |
|---|---|---|
| O | >25,000 | Neutral and ionized He |
| B | 11,000—25,000 | Neutral He, some H |
| A | 7,500—11,000 | strong H; ionized metal (Ca II, Mg II) |
| F | 6,000—7,500 | weak H; ionized metal |
| G | 5,000—6,000 | ionized and neutral metal |
| K | 3,500—6,000 | strong metal |
| M | <3,500 | molecules (TiO, MgH) |
| Stellar classes by spectral line prominence. See Table 8.1 of CO | ||
end of module 3
—congrats—