Stars and Planets

—Light—
Chris Ormel

Roadmap module 1
Physics of Light
Obtain a basic understanding on how light is defined physically
Light and Distances in Astronomy
Understand how astronomers measure distances to and brigtness of objects
Hertzsprung Russell (HR) diagram
(Also: color-magnitude diagram). Understand the basics of the most famous diagram in Astronomy; locate the positions of stars on the HR diagram.
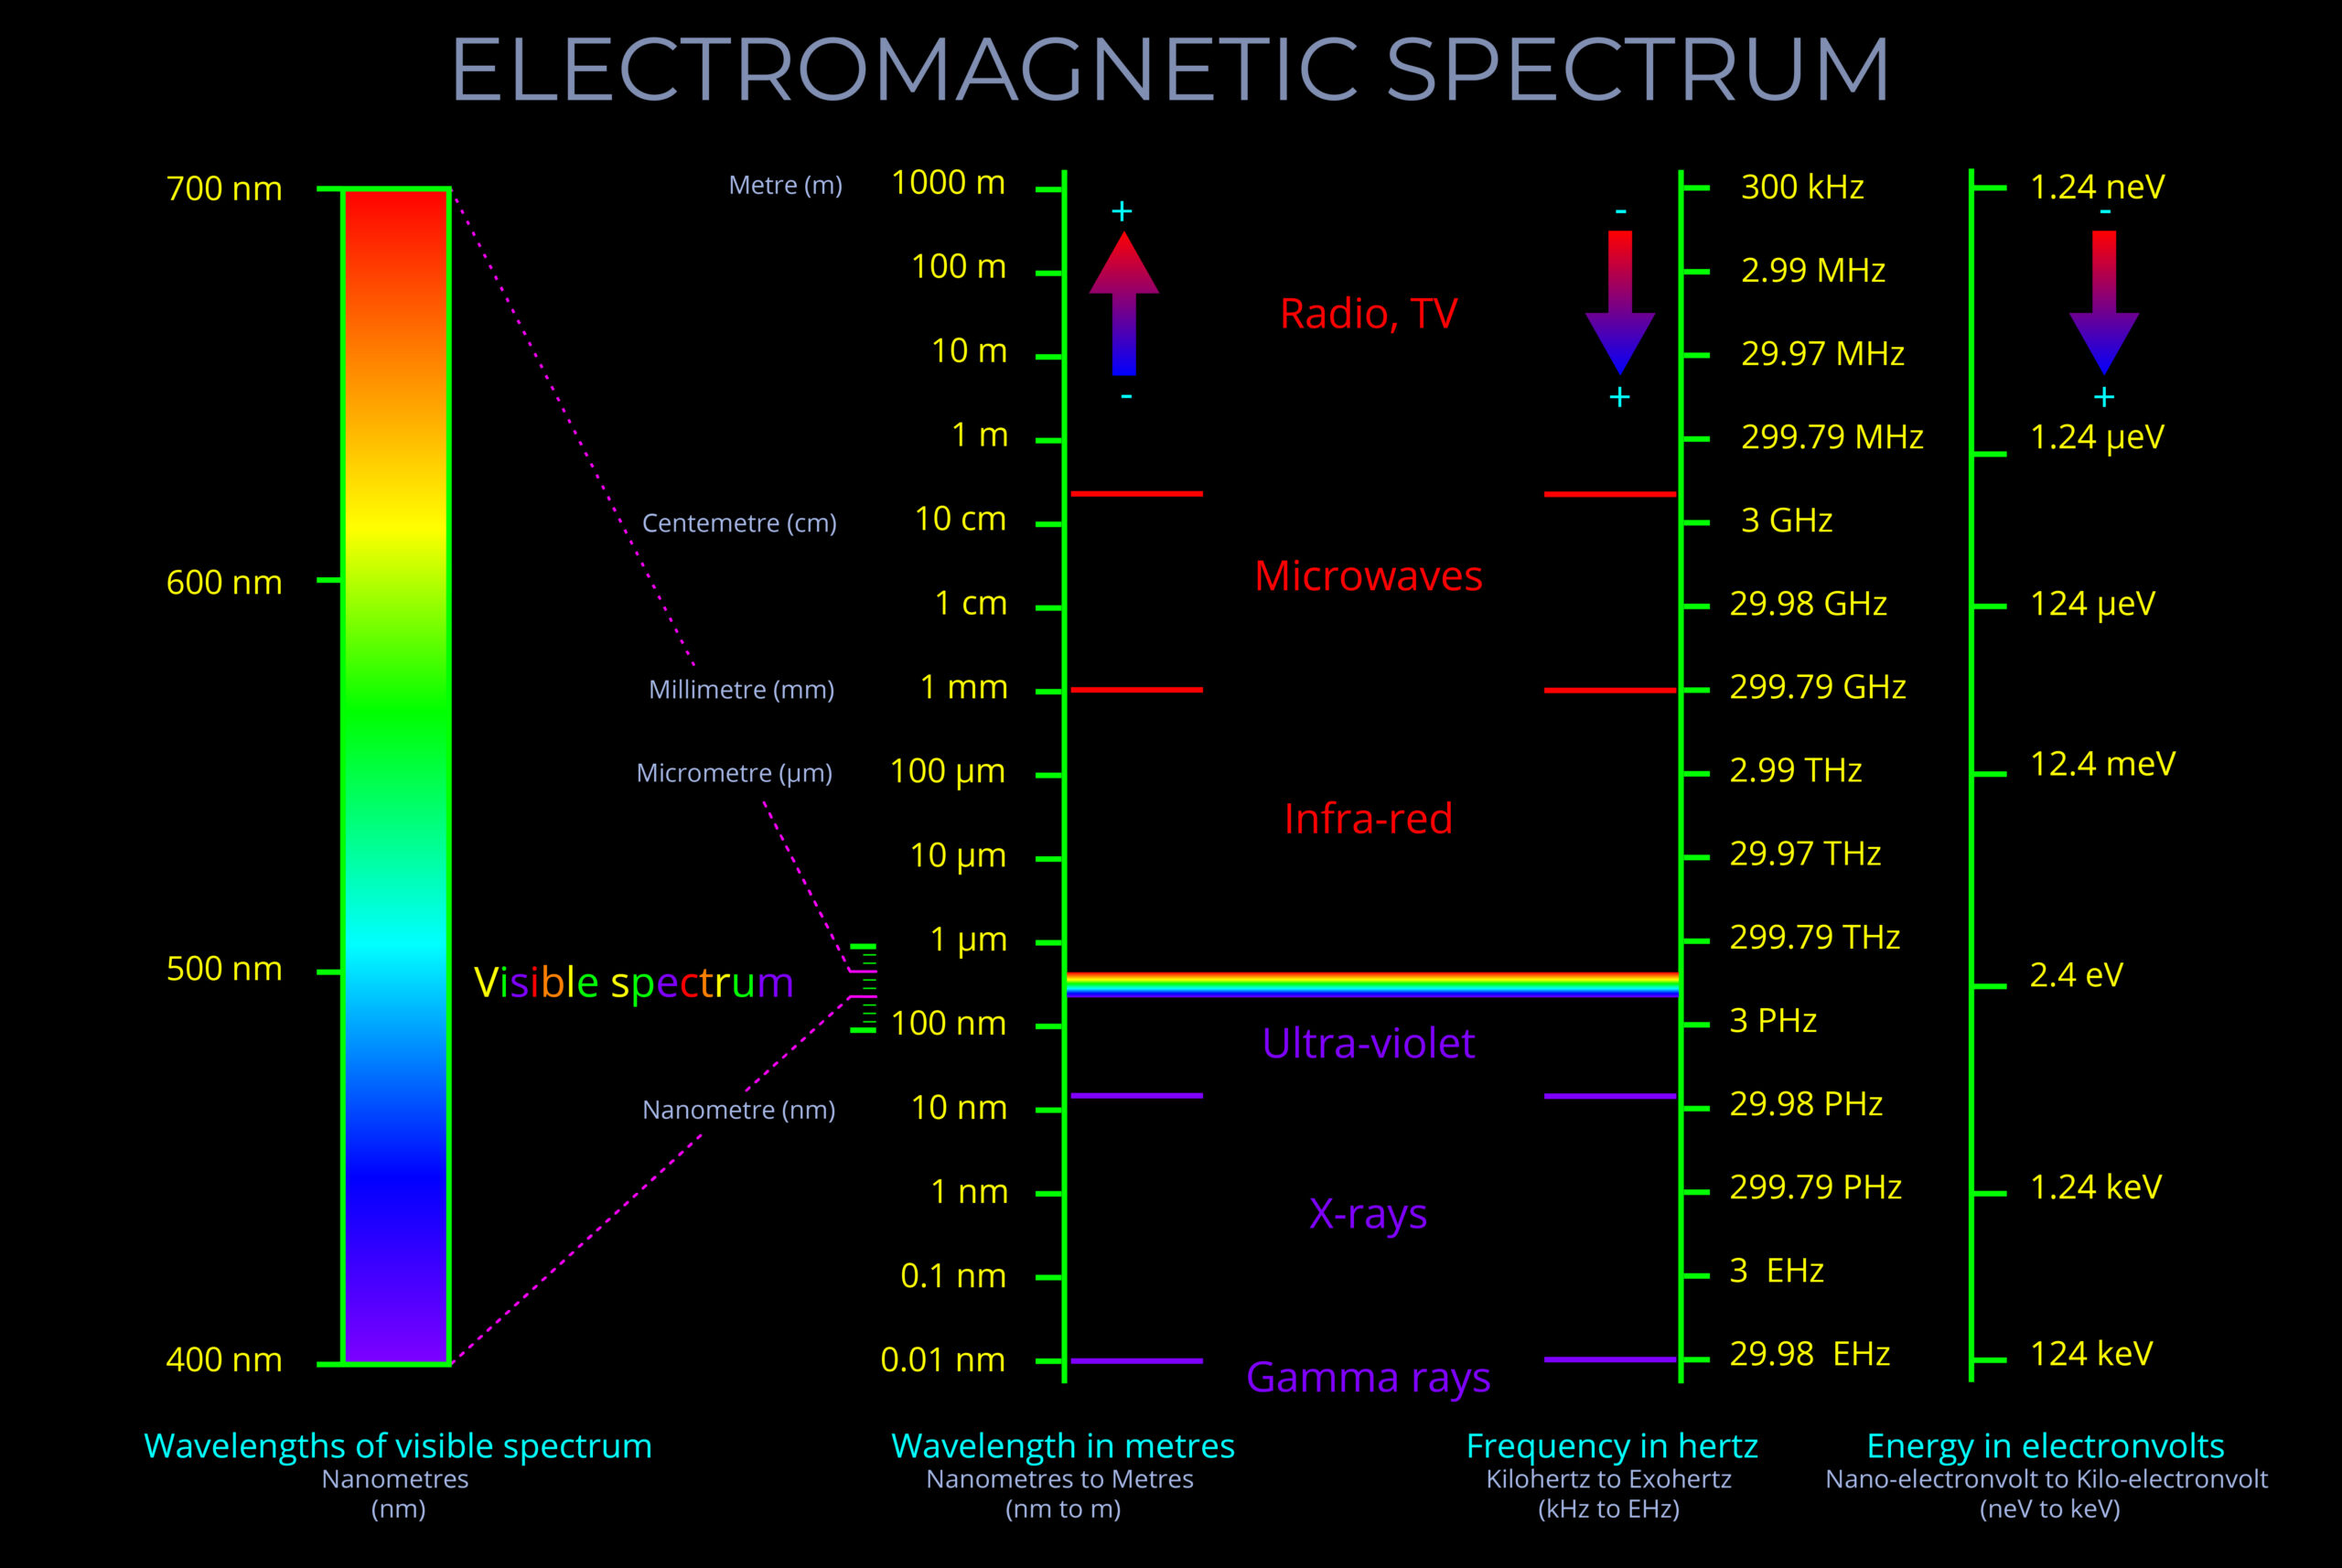
Electromagnetic spectrum
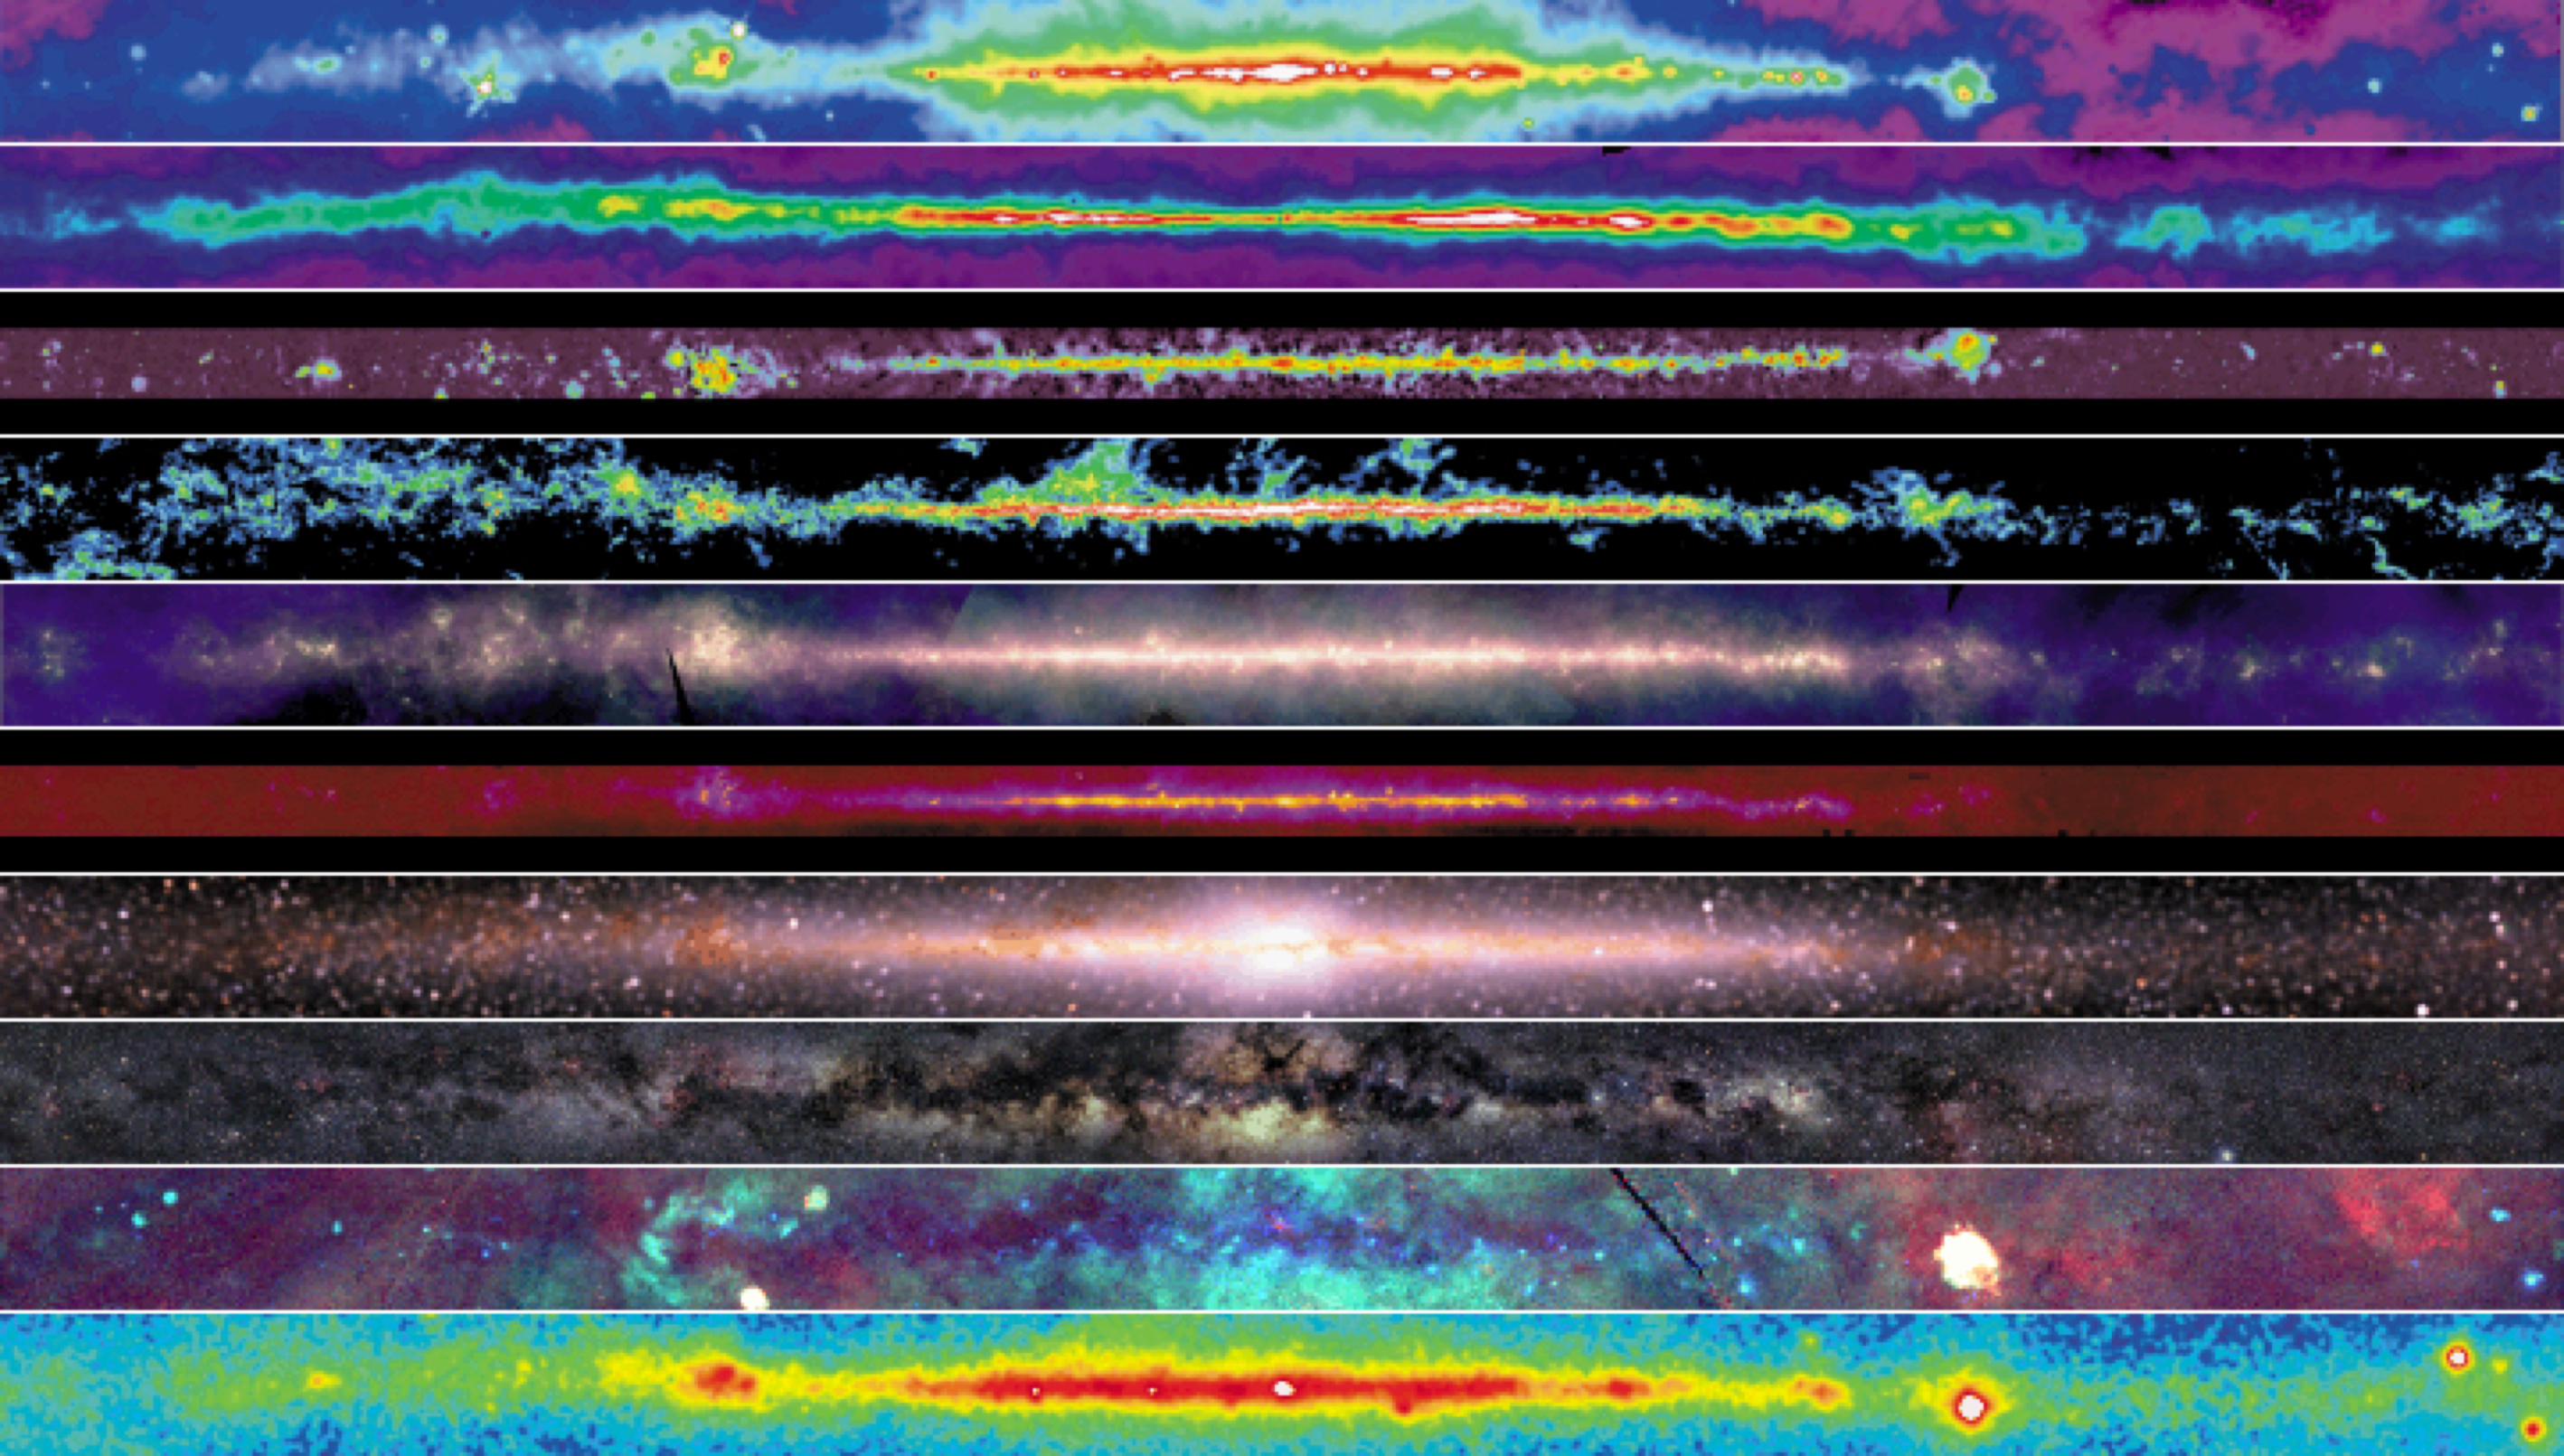
Radio continuum
Synchroton emission (fast electrons)
Cas(iopeia) A
supernovae remnant
Electromagnetic spectrum

Atomic hydrogen
Electromagnetic spectrum

Radio continuum
synchroton emission (fast electrons) and free-free emission (hot ionized regions)
Electromagnetic spectrum

J1→0 CO line
molecular gas and star formation regions
Electromagnetic spectrum

far-IR continuum
re-radiated thermal emission (warm dust)
Electromagnetic spectrum

mid-IR continuum
diffuse PAH emission and point source (RGB, planetary nebula, SF-regions)
Electromagnetic spectrum

near-IR
cool K-stars (some absorption by dust)
Electromagnetic spectrum

optical
stars (much absorption by dust)
Electromagnetic spectrum

X-rays
collisions by cosmic rays and pulsars
Electromagnetic spectrum

gamma rays
collisions by cosmic rays and pulsars
Crab Pulsar
Blackboard
- Black-body radiation
- Parallax
- Magnitudes
Radiation
read CO 3.4-3.6 and CO 9.1
A photon gas obeys Bose-Einstein statistics, the spectral energy density is

that is, the product of the density of states, the energy, and the probability that it is occupied. where
 is frequency,
 is Planck's constant,
 temperature, c the speed of light, and k Boltzmann constant. The derivation follows from statistical mechanics principles.
the spectral intensity with which the energy escapes to space is :

This is the Planck function (black-body radiation): the amount of energy radiated per unit area, per unit frequency, per unit solid angle (spatial angle)
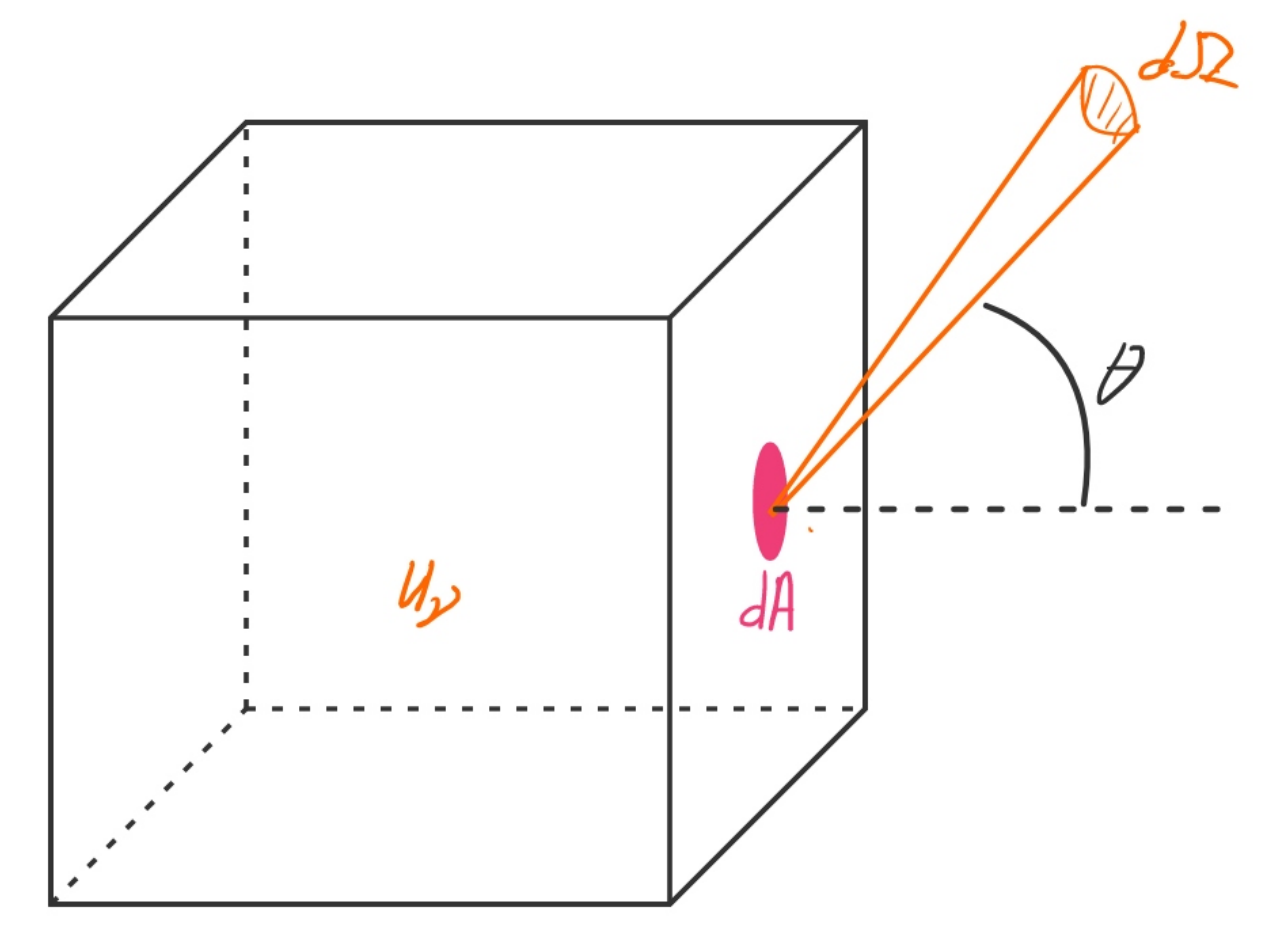
 and intensity
 .
The latter is defined as the energy traveling through an area dA per unit time per unit solid angle
 in a certain direction.
Radiation
read CO 3.4-3.6 and CO 9.1
Integrated over frequency, we obtain:
- The total photon energy density:
![]()
where
![]() is Stefan-Boltmann constant.
is Stefan-Boltmann constant.
- The radiated power per unit area
![]()
- The total power radiated by a spherical body
(Stefan-Boltzmann law)
![]()
where L is luminosity and R the radius.
It is customary to define the effective temperature![]() in this way:
in this way:
![]()
even when the radiation does not follow a blackbody.
Radiation
read CO 3.4-3.6 and CO 9.1
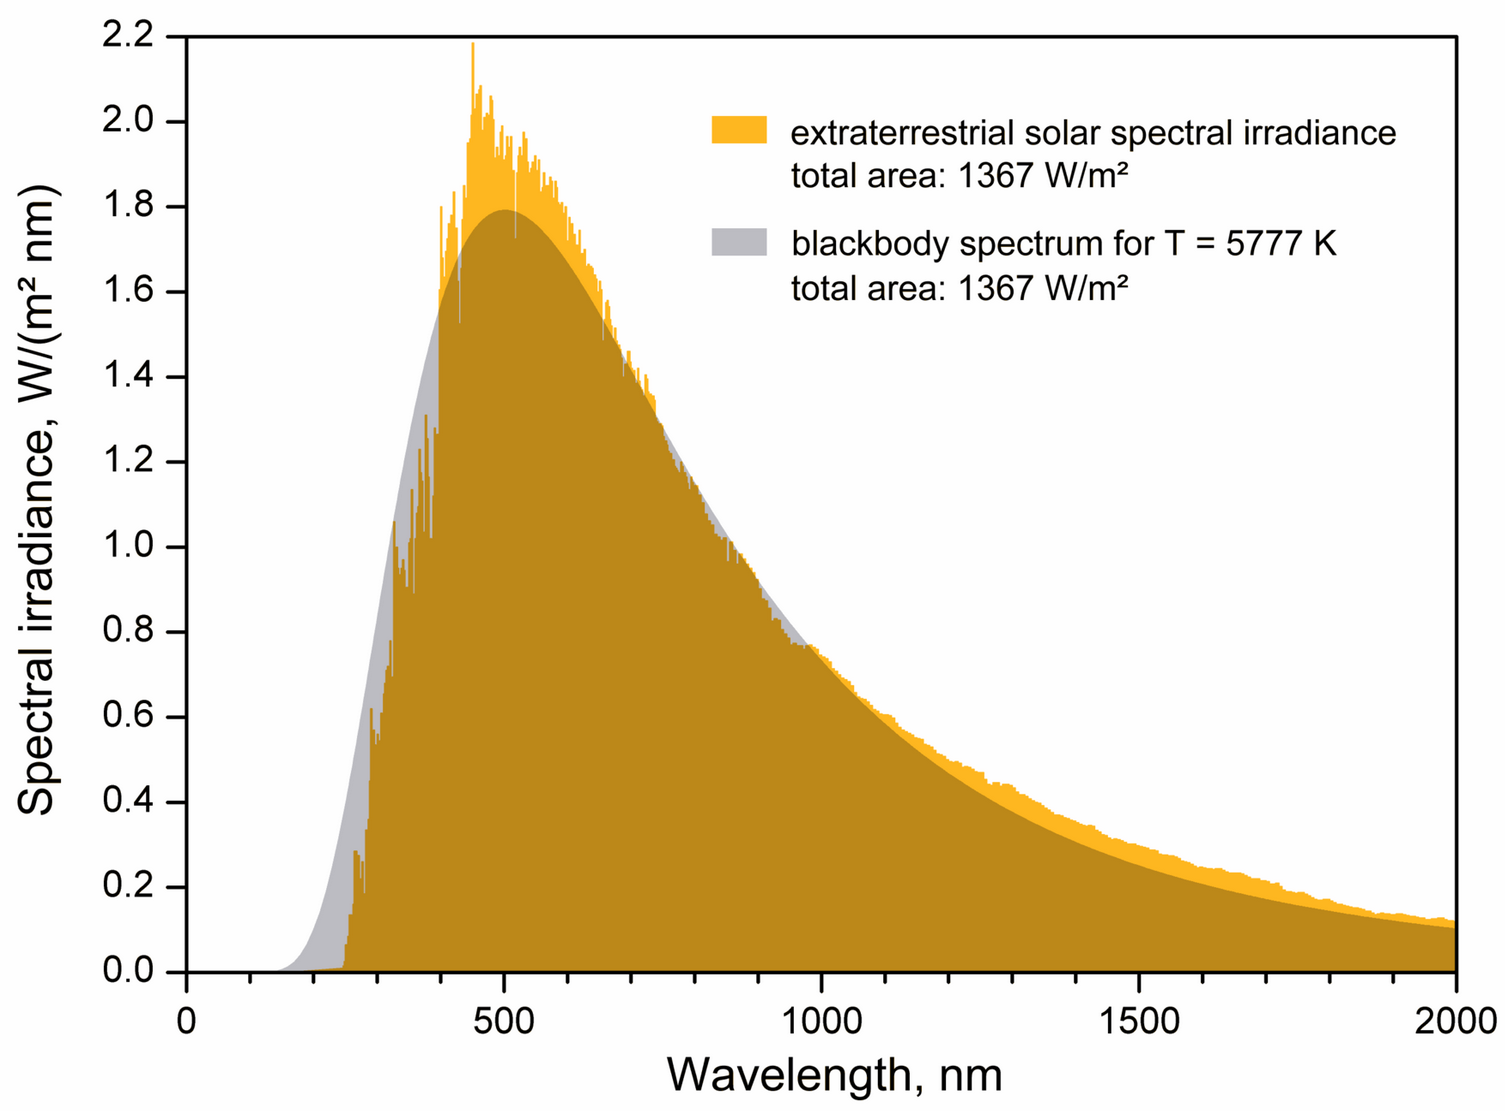
Properties Planck function

- The peak of the blackbody spectrum shifts to shorter wavelength for hotter blackbodies. It is known as
Wien's displacement law:
![]()
- Rayleigh-Jeans law at long wavelengths:
![]()
- Wien's approximation at high frequencies

 as function of wavelength. The dotted line follows the peak of the energy spectrum
The relation
 can be used
to convert
 into
into
 .
.
Distance measurements — Parallax
In Astronomy, it is challenging to measure distances.
The parallax method is an astrometric method to obtain distances to relatively close stars. Over the course of a solar orbit, they will change their position on the sky. The definition of parallax is such that a shift of 1 arcsec ('') corresponds to a distance of 1 parsec (pc).

1'' = 1/3600 deg. It follows that

- Proxima-Centauri, the closest star, has a parallax of 0.7685.
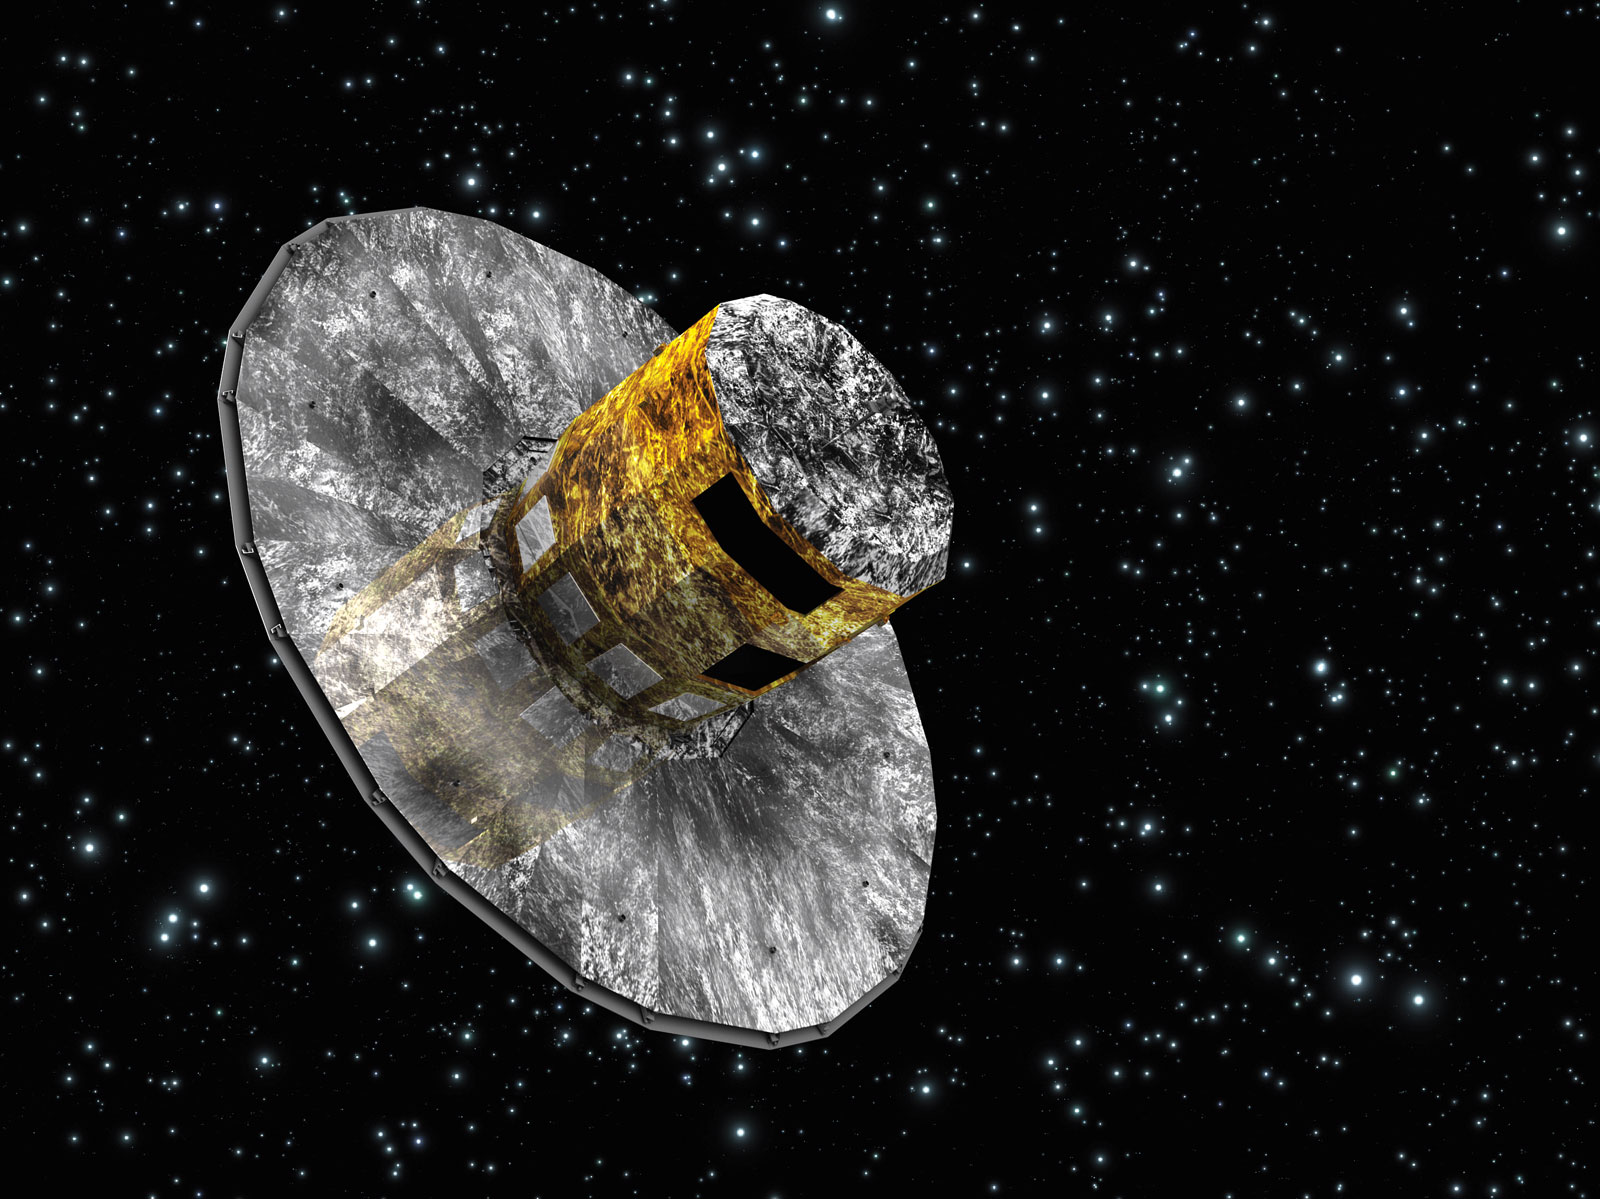
- The GAIA spacecraft will measure parallax angles to an accuracy of 10 micro arcseconds (μas or μ''). The astrometric technique will also allow us to detect many planets around stars (why?)
→ Definition of parallax (c) Wikipedia

Distance measurements — Cepheids
Cepheids are pulsating stars that have a well studies Luminosity-Period relationship.
The physical reason will be explained in later lectures
- by measuring the period of the pulsation, the luminosity follows.
- stars like Cepheids are known as standard candles (We know their true luminosity)
- with powerful facilites, Cepheids can be resolved in galaxies, ~10 Mpc
Historically, the empirical relationship was discoverd by Henrietta Swan Leavitt. It was used to measure the distances to the Magallenic Clouds—satellite galaxies to the Milky Way.
→ top: period-luminosity relationship of Cepheids,
(c) ATNF
bottom: kappa Pavonis light curve with TESS. (c) Warrick Ball -- Wikipedia


Magnitudes
In astronomy we often express brightness on a logarithmic —magnitude— scale
- magnitudes are always defined relative to a reference flux:
![]()
Brighter stars have lower magnitude! The key significance of magnitude lies in its relative scaling, not in the absolute value
![]() .
Often the star Vega — or rather the emission corresponding to an 11,000 K blackbody — is used for the reference magnitude
.
Often the star Vega — or rather the emission corresponding to an 11,000 K blackbody — is used for the reference magnitude
Or, between two stars a difference in flux amounts to a different in magnitude of
![]()
where
![]() is
the magnitude of star 1,
is
the magnitude of star 1,
![]() the magnitude
of star 2,
the magnitude
of star 2,
![]() the brightness
of star 1,
the brightness
of star 1,
![]() the brightness of star 2.
the brightness of star 2.
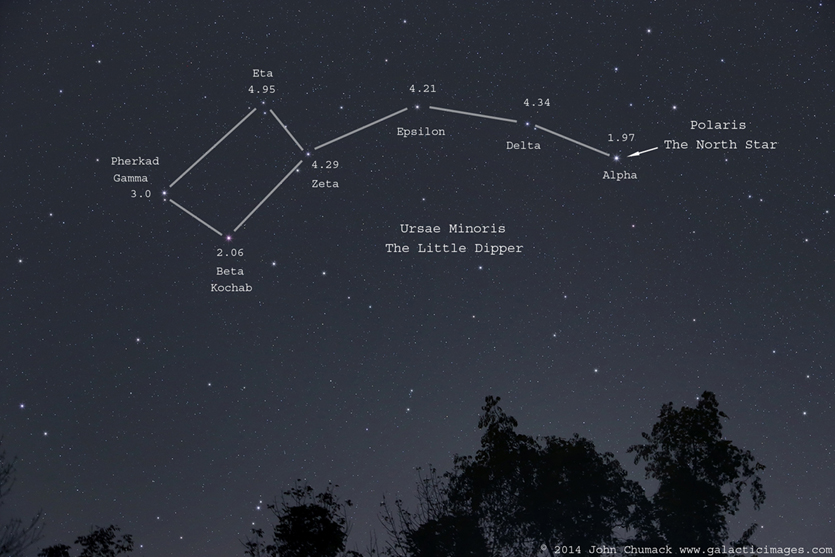
Stars that differ by a factor 100 in brightness, differ by 5 magnitudes with the brightest star having the lowest value!
Magnitudes
In astronomy we often express brightness on a logarithmic —magnitude— scale
- magnitudes are always defined relative to a reference flux:
![]()
- Absolute (intrinsic) and apparent magnitudes:
- absolute magnitude M expresses the brightness of a star as seen from a distance of 10 pc
- apparent magnitude m expresses the brightness as we see it from Earth
![]()
where m-M is called the distance modulus

Magnitudes
In astronomy we often express brightness on a logarithmic —magnitude— scale
- magnitudes are always defined relative to a reference flux:
![]()
- Absolute (intrinsic) and apparent magnitudes:
![]()
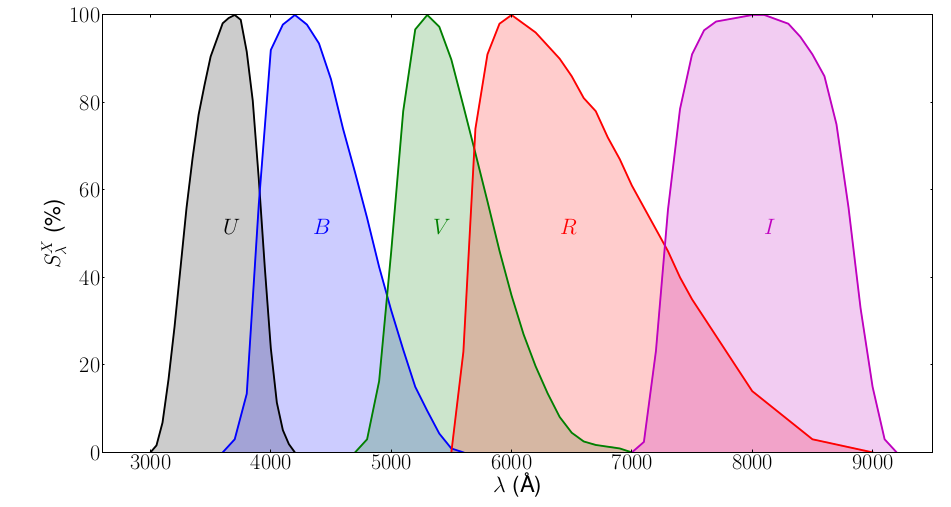
- A difference in magnitudes between two wavelengths filters, is called a
color:
![]()

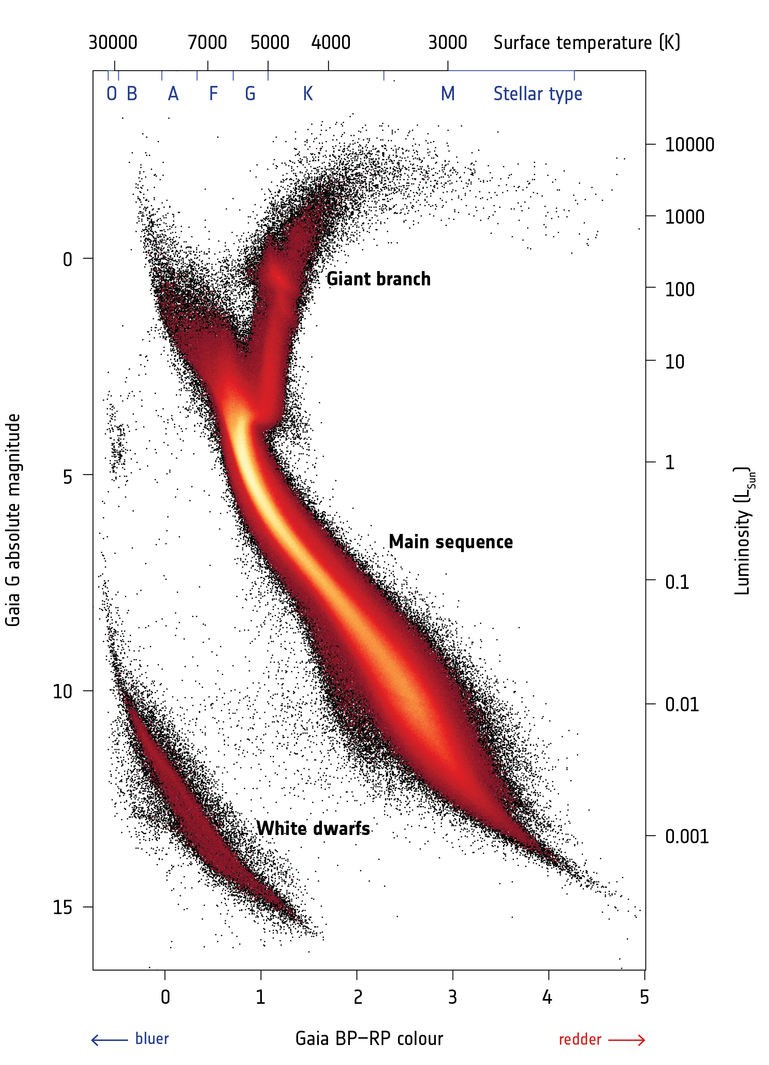
Hertzsprung-Russell diagram

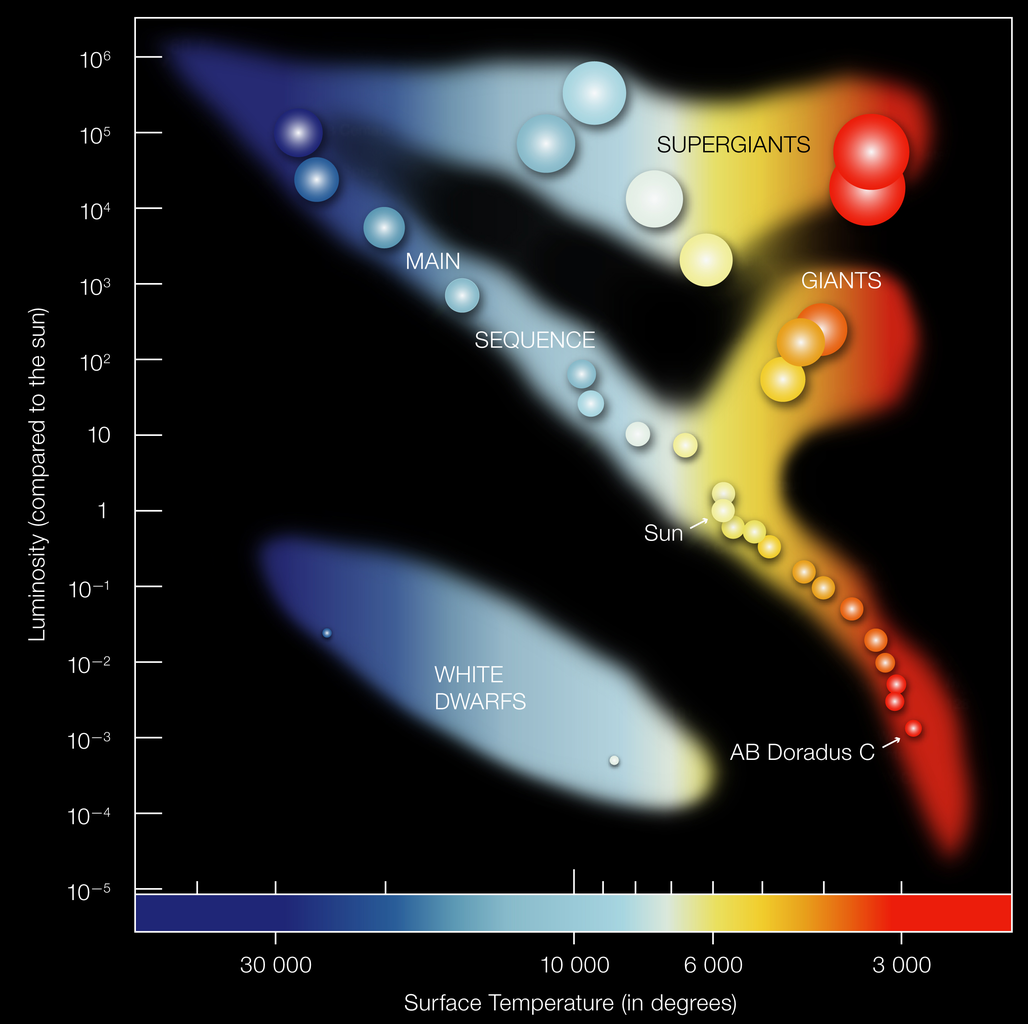
Arguably the most important diagnostic tool in Astronomy! One identifies:
- Main-sequence (MS): diagonal line; increase for stars with different mass
MS-stars are stars that fuse hydrogen into helium
- Red giant branch (RGB)
Stars ascend it after H-burning stops in the core
- Supergiant branch
Massive stars that have left the MS
- White Dwarf branch
"Dead" remnant of stellar cores
- Hayashi track
nearly vertical line in HR-diagram; stars (in equilibrium) cannot cross it
Note: In all HR-diagrams (or its observational equivalent, the color-magnitude diagram ) brigh(ter) stars can be found at the top, while red(der) stars are at the right.
Color-magnitude diagram (CMD)
Note: In all HR-diagrams (or its observational equivalent, the color-magnitude diagram ) brigh(ter) stars can be found at the top, while red(der) stars are at the right.
← An example of a color-magnitude diagram from the GAIA satellite, plotting absolute magnitude vs color.
end of module 1
—congrats—
