Stars and Planets

—Stellar Evolution—
Chris Ormel

Roadmap module 5
Opacity
The "resistance" light experiences in penetrating matter
Heat transport
Mechanism to transport heat (radiative diffusion, convection, conduction)
Stellar structure equations
The equations that govern the structure and evolution of stars. Usually solved numerically with codes like MESA
Homology
A simplification to the stellar structure equations that allows for analytical scaling solutions
Stellar evolution
A description of how stars interior and appearance changes with time and how these changes depend on parameters, such as the initial mass
High-mass stellar evolution
High-mass stars deviate from evolution from low-mass stars and play a critical role in nucleosynthesis
- radiative and convective temperature gradient
- Schwarzschield stability criterion
- mass-radius and mass-luminosity relationships
- Hayashi track
- H (shell) burning
- He flash
- Stellar nucleosynthesis
Topics
- Random walk & opacity
- Radiative and convective heat transport
- Stellar structure equations
- Homology
Mean free path and opacity
— read CO Ch. 9.2 and 9.3 —
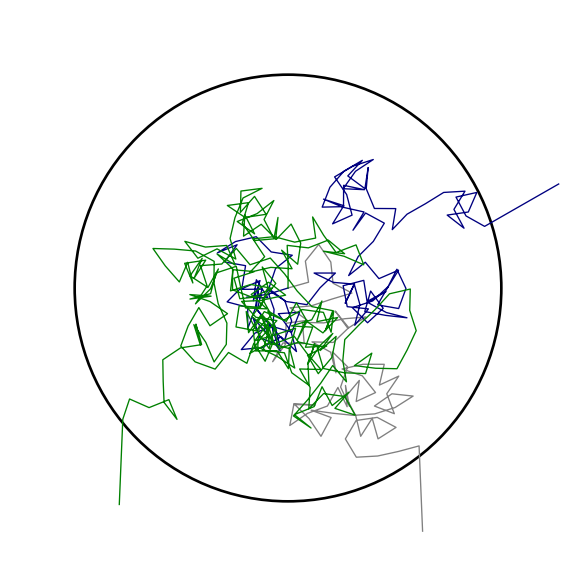
- (photon)
mean free path
: distance before a photon gets absorbed or scattered:
![]()
ni: number density of absorbers per unit volume;
σ: absorption cross section -
opacity
: inverse mean free path — the transparancy — normalized by density
![]()
Other definitions for opacity exist. In our definition it is the total cross section per unit mass of the medium (units: cm2 g-1).
-
optical depth
: number of mean free path length over a length L
![]()
Mean free path and opacity
— read CO Ch. 9.2 and 9.3 —
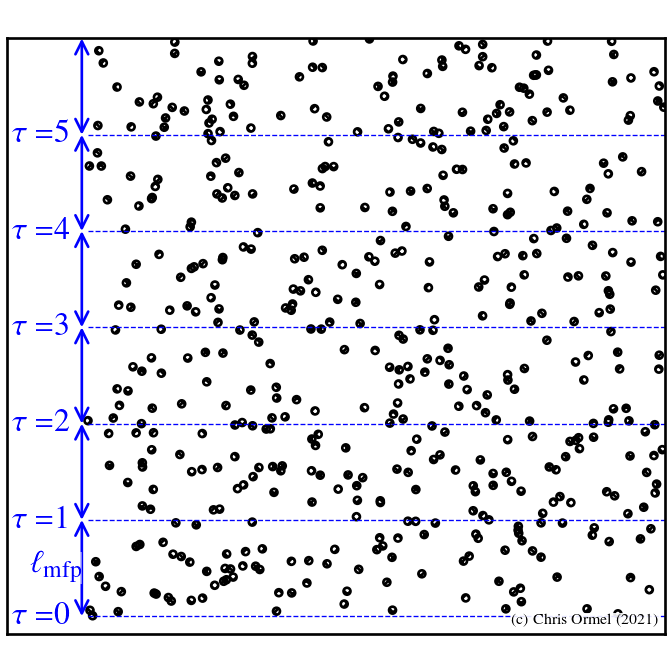
- (photon)
mean free path
: distance before a photon gets absorbed or scattered:
![]()
ni: number density of absorbers per unit volume;
σ: absorption cross section -
opacity
: inverse mean free path — the transparancy — normalized by density
![]()
Other definitions for opacity exist. In our definition it is the total cross section per unit mass of the medium (units: cm2 g-1).
-
optical depth
: number of mean free path length over a length L
![]()
Mean free path and opacity
— read CO Ch. 9.2 and 9.3 —
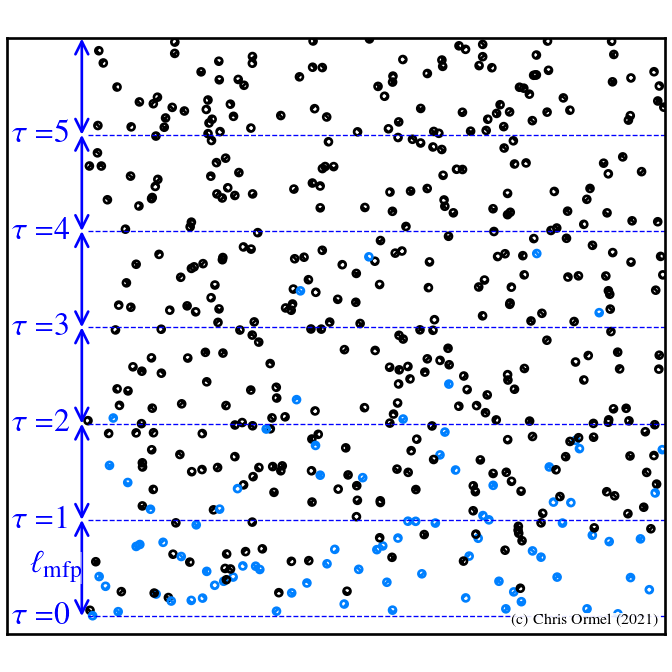
- (photon)
mean free path
: distance before a photon gets absorbed or scattered:
![]()
ni: number density of absorbers per unit volume;
σ: absorption cross section -
opacity
: inverse mean free path — the transparancy — normalized by density
![]()
Other definitions for opacity exist. In our definition it is the total cross section per unit mass of the medium (units: cm2 g-1).
-
optical depth
: number of mean free path length over a length L
![]()
opacity
— see CO 9.2 —
Sources of opacity:
- electron scattering
![]()
where
![]() is the Thomson cross section (see module 4).
is the Thomson cross section (see module 4).
- Electron scattering dominates in stellar interiors. where gas is ionized.
- At very high T (frequency), we have that
![]() (transition to Compton scattering)
(transition to Compton scattering)
Question: Why can't free electrons absorb photons?
Question: Why the (1+X) factor?

opacity
— see CO 9.2 —
Sources of opacity:
- electron scattering
- Free-free and bound-free
![]()
(cgs units). These forms are Kramer's laws where frequency-dependent opacities have been averaged over the radiation field (Rosseland mean). Expressions are very approximate and are valid only in a certain T-range.
Question: How do we get the combined opacity at a single frequency, κν?
Question: Why is the Rosseland mean opacity harmonically averaged over the radiation field?
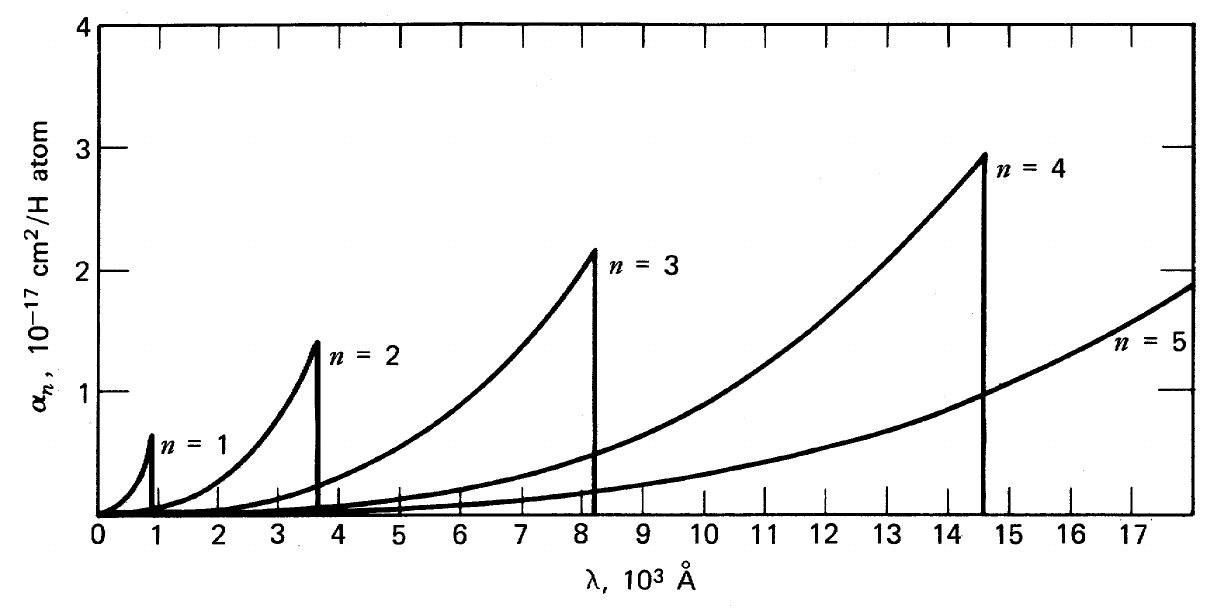
These opacities are so called Rosseland mean opacities:

that is, the inverse of the opacity (the "transparancy") is weighted by the radiation field.
Why the suddon drop in opacity to 0 at these "cliffs"?
opacity
— see CO 9.2 —
Sources of opacity:
- electron scattering
- Free-free and bound-free
![]()
- negative H (H—) opacity
![]()
valid for 3,000 < T < 6,000 and -10 < log10 ρ < -5. Important in "cool" atmospheres, where neutral H can bind a second electron. This electron has a low binding energy (compared to neutral H); it dissociates with photons energies above 0.75 eV (~104 K).
- conductive opacities
degenerate regions

These opacities are so called Rosseland mean opacities:

that is, the inverse of the opacity (the "transparancy") is weighted by the radiation field.
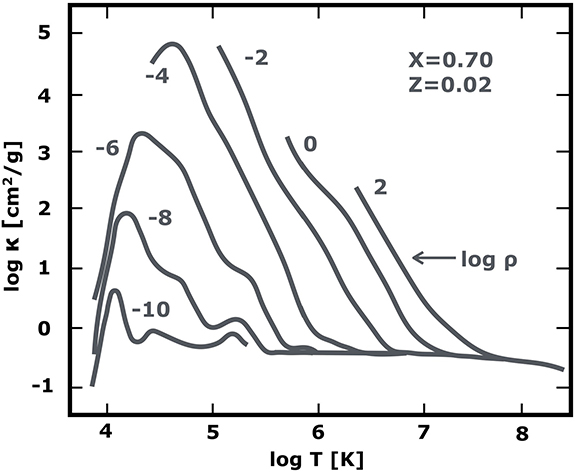
solar opacities
use opacity tables to find
 as function of temperature and pressure.
We identify with increasing T and ρ:
- H— opacity near the Sun's photosphere
- strong increase in H— opacity. After this peak H-ionization reduces the H— opacity
- bound-free opacities, followed by free-free dominate in the interior
- solar core. Opacities just higher than electron scattering limit
Radiative and convective heat transport
— read CO 10.4 —
Energy transport by diffusion of radiation results in an energy flux (units: [E L-2 T-1]) of

with
 the radiation energy density,
 the
photon diffusivity,
 the mean free path,
c the speed of light,
 the opacity.
Equating this to the luminosity flux,
 one obtains

where
 is the opacity weighted by the radiation field
(Rosseland mean).
Following convention, the temperature gradient is recast in terms of a gradient with respect to pressure

With the hydrostatic balance equation, this radiative temperature gradient becomes

 needs to adjust to
 in order for the energy to be transported by radiation!
Radiative and convective heat transport
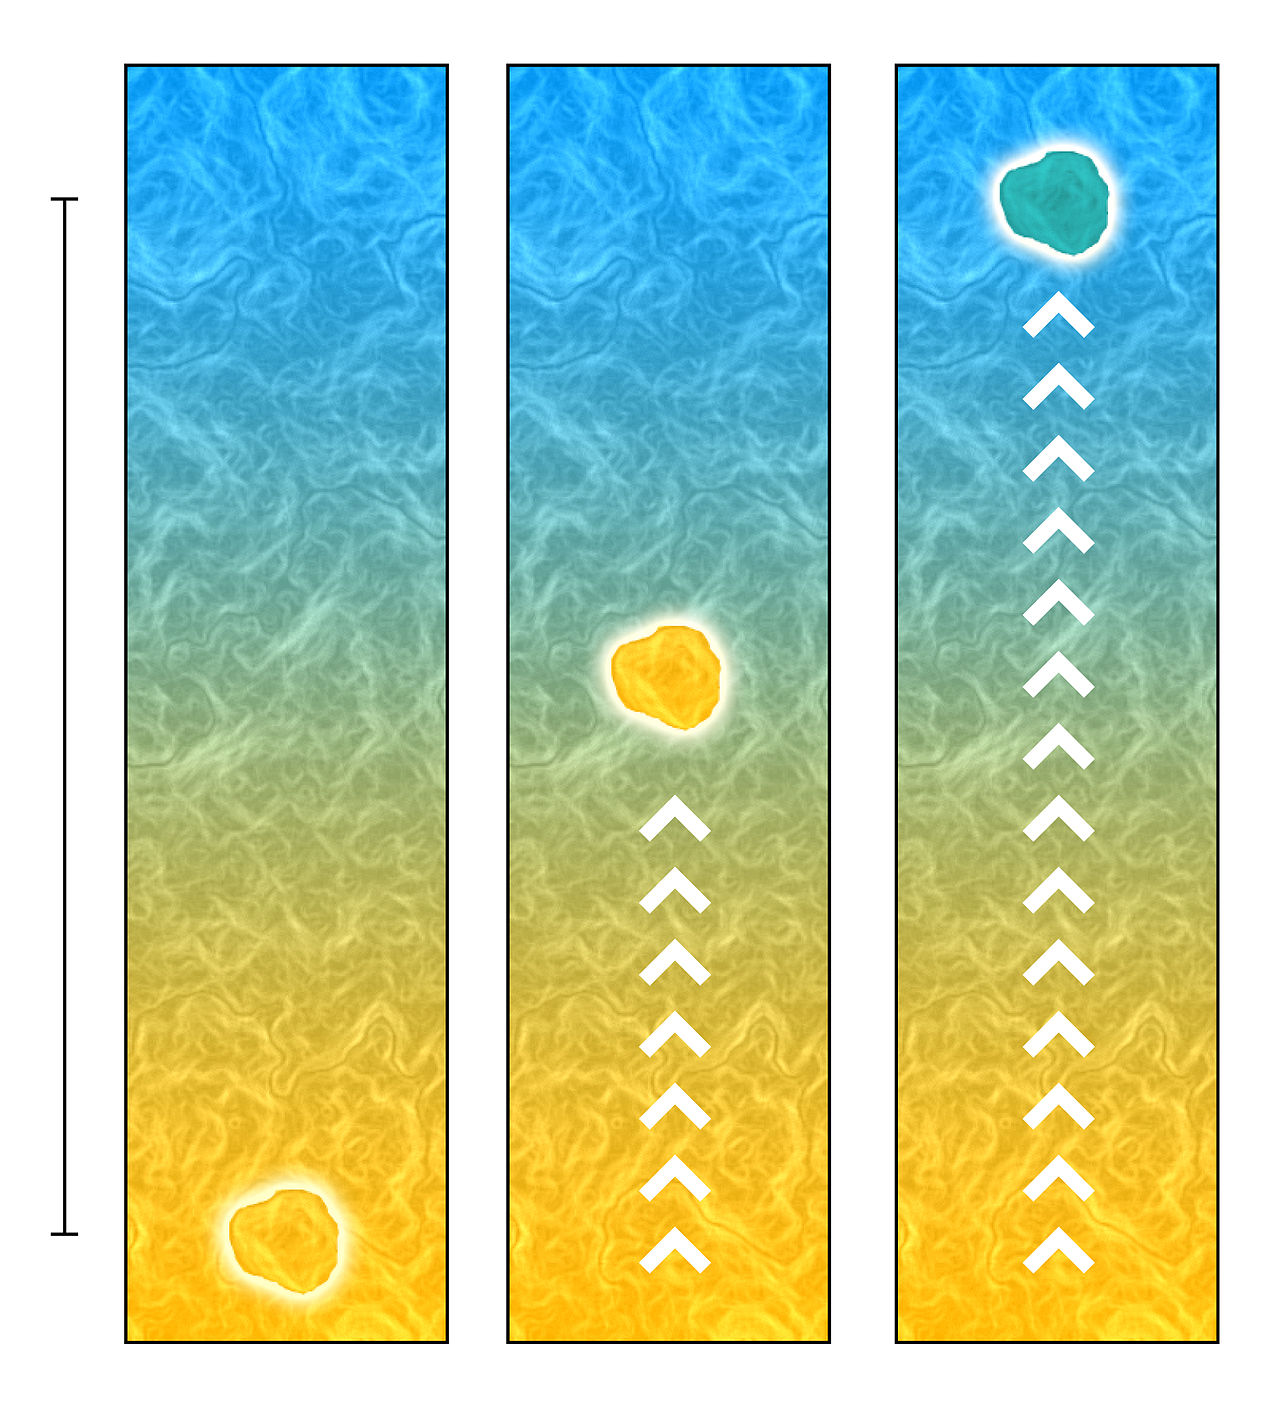
The stability condition against convection is

the adiabatic exponent. A strong density gradient (stratification) — dense material below light material — stabilizes fluids.
If we define the EoS as:

where
 for an ideal EoS. In the adiabatic case, we obtain

the stability criterion transforms to:

rise
after lmix
Radiative and convective heat transport
some thermodynamical relations may be helpful

where
 are the heat capacities at constant pressure and temperature. from this the heat capacity ratio
 follows. Another is the first law of thermodynamics:

if we put
 we obtain a relationship between the heat capacity ratios


rise
after lmix
Radiative and convective heat transport
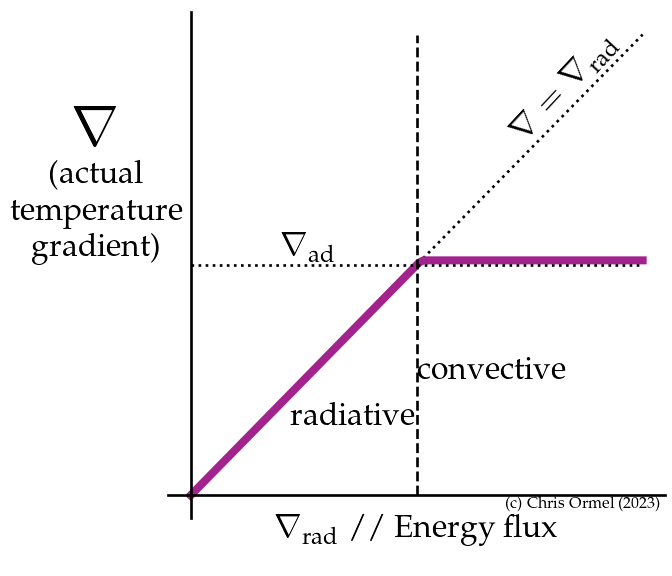
When the radiative gradient becomes too steep, convective "blobs" will rise because they stay lighter than the surroundings. The condition for convection is:

which is Schwarzschield criterion (ignoring any composition gradient). More preciese, in a convective medium, the relation

holds.
- the actual temperature gradient
![]() is less than the radiative gradient
is less than the radiative gradient
![]() as part of the flux is carried by convection.
as part of the flux is carried by convection.
-
![]() must hold for convection
must hold for convection
- Blobs themselves are never fully adiabatic (
![]() ).
).
Theories as Mixing length theory offer a phenomenological model to calculate the energy flux that can be carried by convection.
It turns out that that under most (stellar) conditions
 is an acceptable approximation. In other words, convection in stars is very effective. The temperature gradient only needs to be slightly above adiabatic to carry the entire energy flux!
Radiative and convective heat transport
In mixing length theory the convective blobs are assumed to travel for a mixing length
 before equilibriating with the surroundings

where δq and δT are differences betweeen the heat contents and temperature of the blobs with its surroundings, e.g.,
 cP is the heat capacity at constant pressure, vbl is the velocity of the blobs. After further manipulation and phenomenological reasoning, one obtains

where α ~ β ~ 1 and
 If we take
 (the convective bubbles are anyway modelled as adiabatic), it follows that for stellar conditions only a slight overadiabicity,
 suffices to transport the energy flux
 by convection.

rise
after lmix
Stellar structure equations:
read CO p.330—334
Stellar structure equations
- Lagrangian formulation is used; radius coordinates r exchanged for mass m
- the temperature gradient
![]() must be provided. Very often
must be provided. Very often
![]()
which is the Schwarzschield criterion. But other choices (e.g. Ledoux criterion) are available.

where m is mass, r is radius, P pressure, T temperature, l luminosity, ρ density, G Newton's gravitational constant
 the temperature gradient, s entropy, ε the energy production rate, and Xi the composition.
Stellar structure equations:
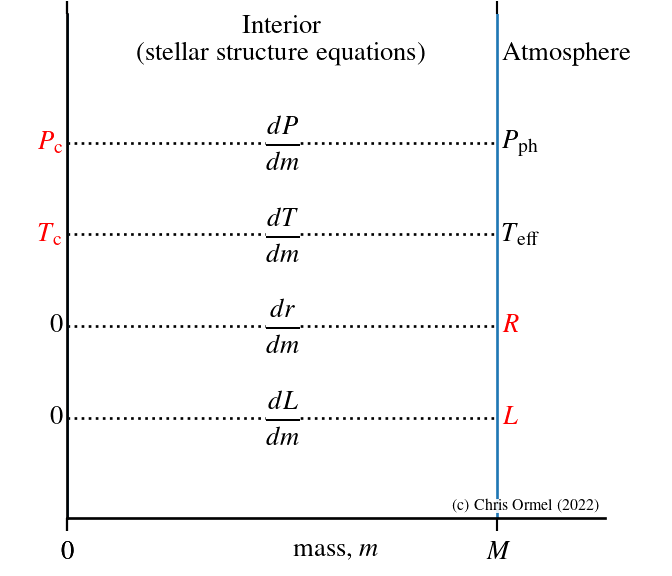
The stellar structure equations represent a system of ordinary differential equations (ODEs). To solve them, we need boundary conditions:
- at the center, m=0: L=r=0 (T and P unknown)
- at the surface, m=M, we can take zero boundary conditions for temperature and pressure: T=P=0
- better to take
photospheric boundary conditions:
![]()
These relations follow from the Eddington approximation for the atmosphere:
![]()
at τ=2/3 — the photosphere — the temperature equals the effective temperature and the pressure can be found by integrating dP/dr to infinity
Stellar evolution — A numerical intermezzo
Stellar evolution is a thoroughly numerical problem. Everything we "know" about star's interiors comes from numerical modelling. Yet, it has proven very successful. Overall, there is a very precise understanding about stellar evolution — especially compared to other astrophysical research fields.
MESA is a publicly available collection of codes ("modules"), aimed towards 1D stellar evolution, which are contributed by many users from the entire planet!
- it is one dimension (1D), so relatively fast
- illuminating and rich
- large international community
Above all, it's fun! Strongly recommend the ambitious student to download and check it out!
this phase so efficiently?
What is the name of this phase?
Why is there no H-burning in the core?
Elements of Stellar Evolution
read CO Ch.13.1—13.2
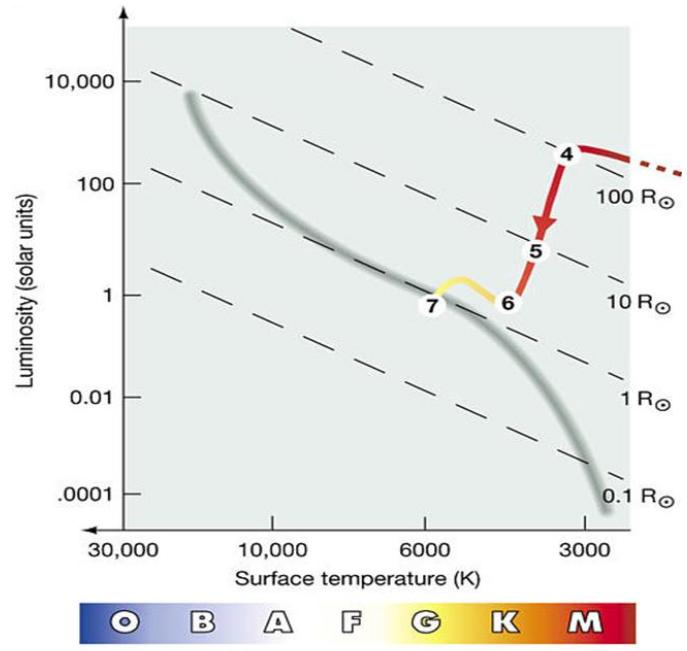
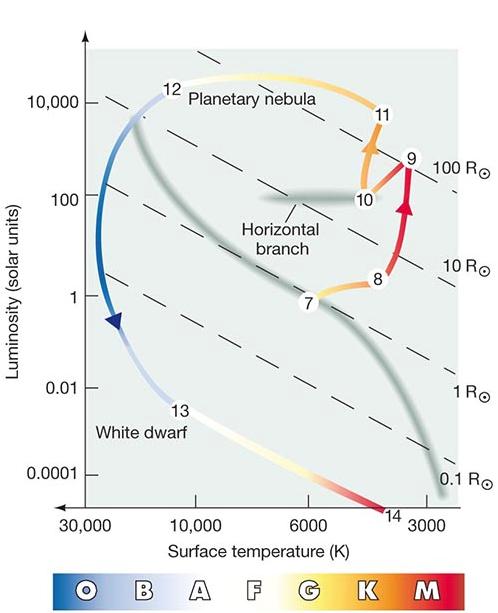
For a solar mass star: 1 molecular cloud collapse; 2 fragmentation; 3 contraction and heat up; 4 protostars and disks; 5 contraction slowing; 6 onset of fusion; 7 main sequence; 8 H shell burning; 9 He flash; 10 He burning; 11 double shell burning; 12 planetary nebular; 13 White dwarf; 14 WD cooling
Homology & stellar evolution
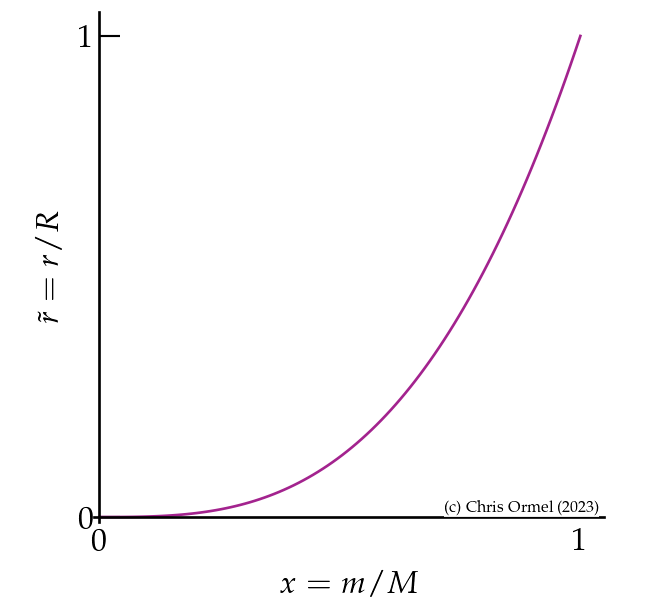
Some insight into the stellar structure equations can be obtained by comparing two stars of different mass, assuming homology

where
 is the homologous mass coordinate
Note: The conditions for homology are only rarely satisfied.
For example, when a stars' core become degenerate while the outer regions expands — the RGB stage — it breaks
Homology & stellar evolution
Applying homology to the stellar structure equations, we obtain:

 , which is approximately the Main Sequence.

Homology & stellar evolution
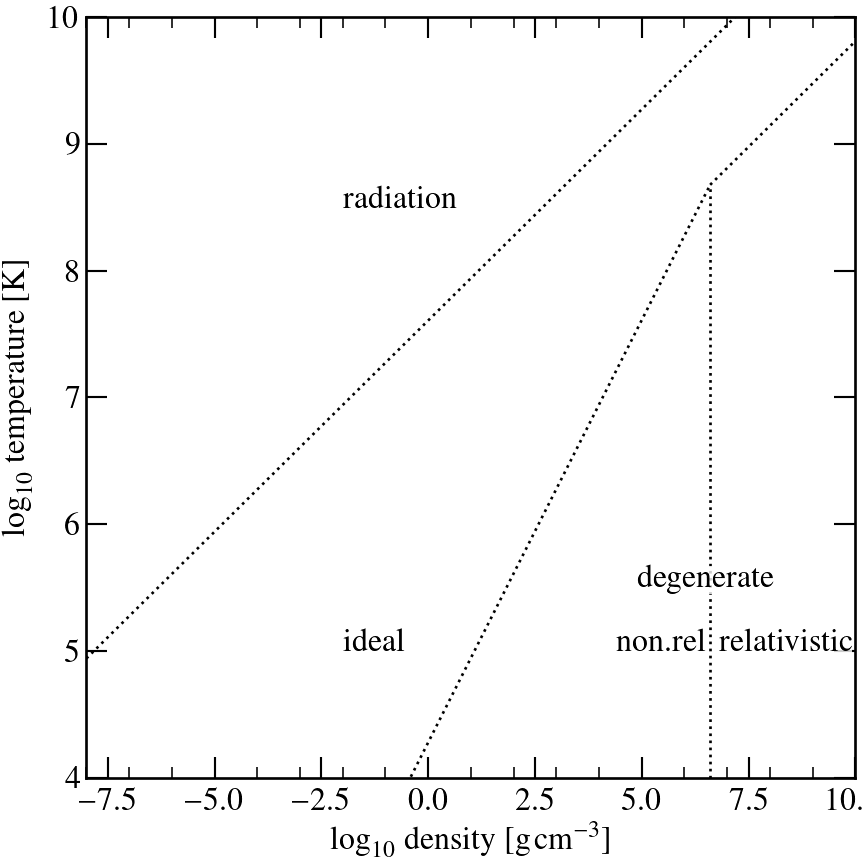
Applying the homologous relationship for the center (
 ) to the general version of the EoS:

-
![]() for the ideal EoS and
for the ideal EoS and
-
![]() for a non-relativistic degnerate electron gas
for a non-relativistic degnerate electron gas
Therefore, for a collapsing star:

Contracting (cooling!) stars heat up for an ideal gas, but contract for a degenerate stars!
Homology & stellar evolution
Stellar evolution can be understood as a continuous (quasi-static) collapse, interceded by prolonged periods of "steady" nuclear burning
- low-mass stars do not reach H-burning temperatures
They end up as Brown Dwarfs.
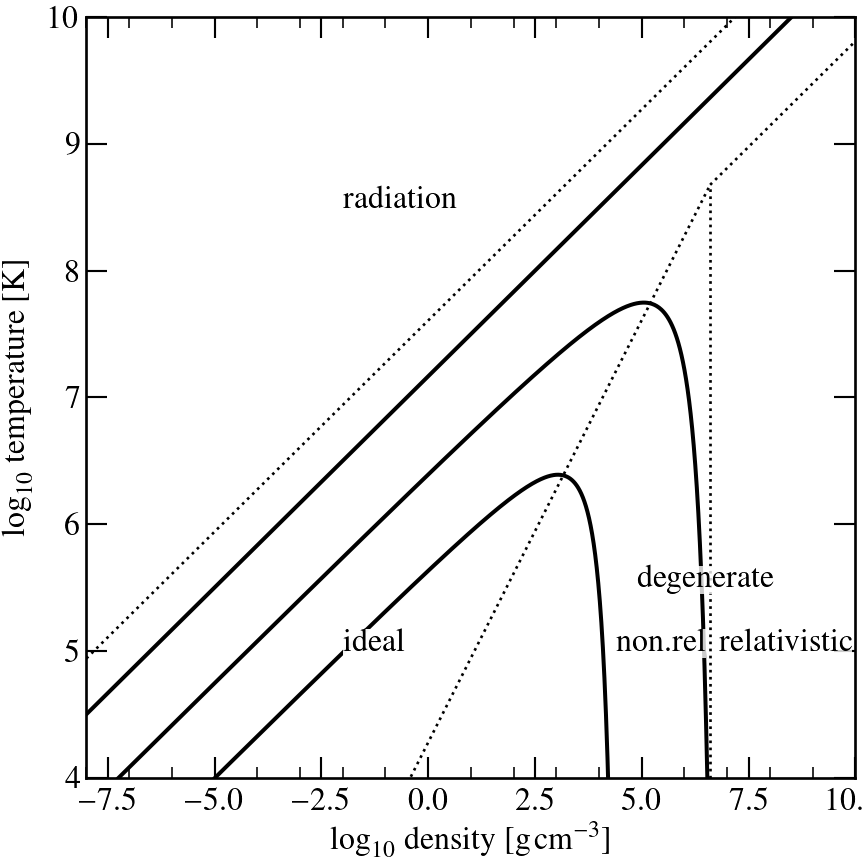
Homology & stellar evolution
Stellar evolution can be understood as a continuous (quasi-static) collapse, interceded by prolonged periods of "steady" nuclear burning
- low-mass stars do not reach H-burning temperatures
- solar-mass stars reach H-burning and He-burning temperatures, but cannot avoid degenerate cooling once their supply runs out
Note: after H-burning the temperature in the now He-core would increase due to the higher μ. This is not reflected in the figure.
Stars end up as degenerate objects (White Dwarfs)

Homology & stellar evolution
Stellar evolution can be understood as a continuous (quasi-static) collapse, interceded by prolonged periods of "steady" nuclear burning
- low-mass stars do not reach H-burning temperatures
- solar-mass stars reach H-burning and He-burning temperatures, but cannot avoid degenerate cooling once their supply runs out
- high-mass stars avoid the "degeneracy trap", burn many elements
More massive than the Chandrasekhar mass; They eventually explode as supernovae

Homology & stellar evolution
Stellar evolution can be understood as a continuous (quasi-static) collapse, interceded by prolonged periods of "steady" nuclear burning
- low-mass stars do not reach H-burning temperatures
- solar-mass stars reach H-burning and He-burning temperatures, but cannot avoid degenerate cooling once their supply runs out
- high-mass stars avoid the "degeneracy trap", burn many elements
- Even higher mass stars would be unstable due to radiation pressure

Evolution in the HR diagram — The Hayashi line
— read CO 12.3 —
- In the limit of
fully convective stars
we can derive the following scaling relationships
![]() This line is known as the Hayashi line. These relationships follow from the following assumptions:
This line is known as the Hayashi line. These relationships follow from the following assumptions:- an n=3/2 polytropic (interior) model,
![]() ,
and
,
and
![]() .
.
- an atmospheric model
![]() that matches the polytropic model (pressure equilibrium)
that matches the polytropic model (pressure equilibrium)
- an opacity relation (H— opacity)
![]() , so
, so
![]() and
and
![]() .
.
- The Stefan-Boltzmann relationship (to eliminate R in liu of L)
- an n=3/2 polytropic (interior) model,
- The extremely weak dependence on T renders the line vertical in the HR-diagram
(although more realistic models will feature some structure)
- Stars in hydrostatic balance cannot exist in hydrostatic equilibrium right of this line (at lower T) !
This is known as the "forbidden zone"
→ Pre main-sequence evolution tracks and observations in Taurus-Auriga star formation complex (Stahler 1988).
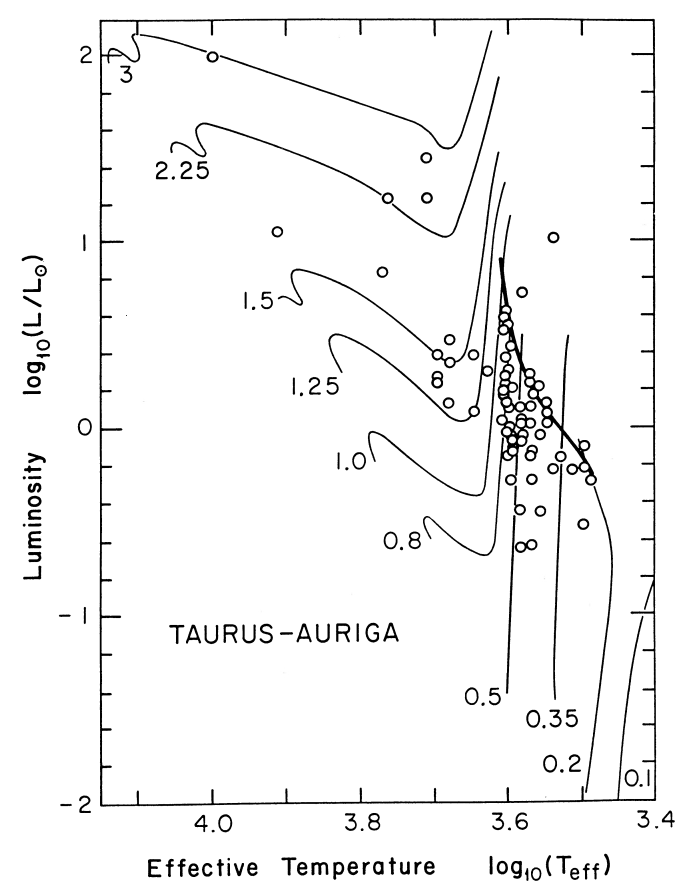
tracks
region
The main sequence (MS)
— read CO 13.2 —
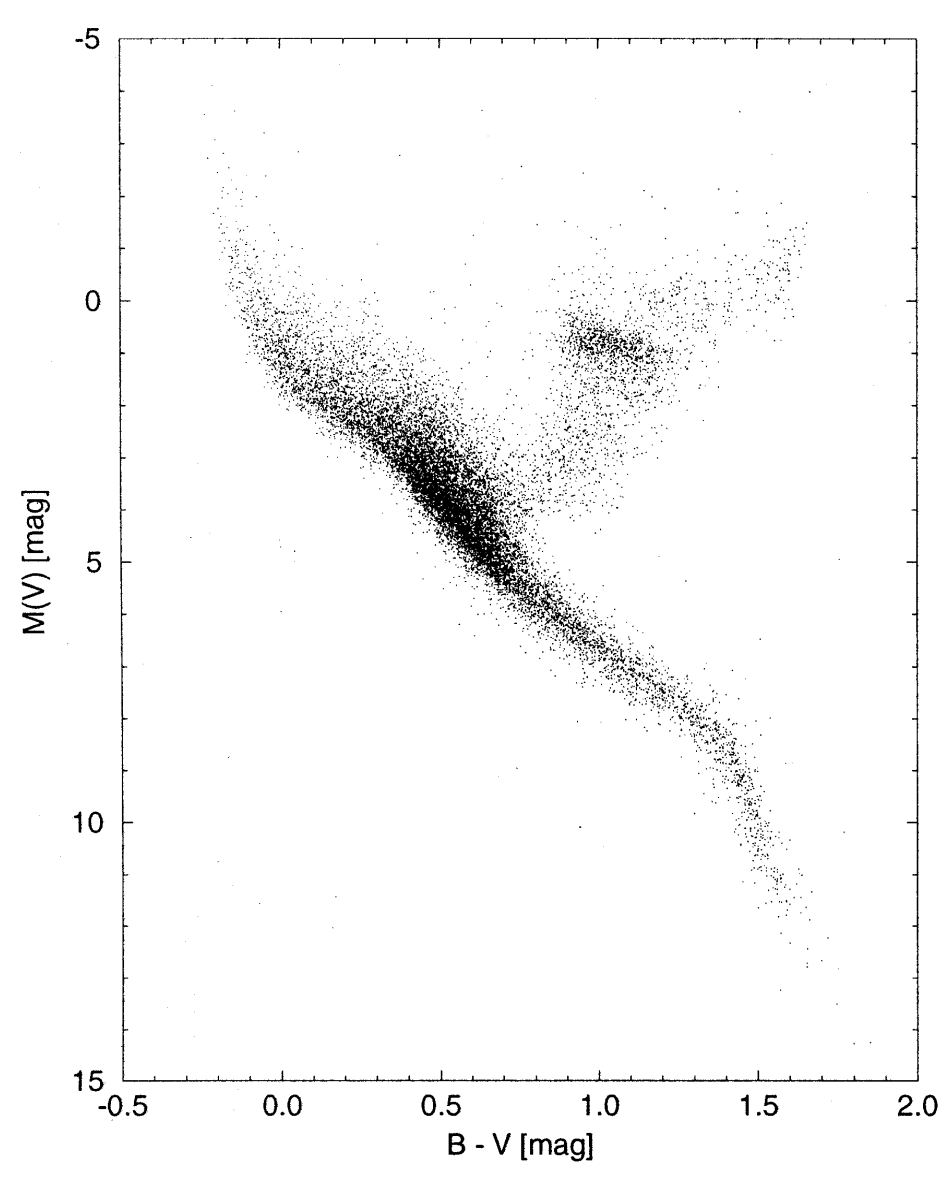
- The place in the HR-diagram where stars burn ("fuse") hydrogen
- Stars follow a mass-luminosity relationship
![]() with
with
![]() for low-mass MS-stars
for low-mass MS-stars
This means high-mass stars quickly leave the MS, while low-mass stars are still on the MS
The main-sequence turnoff is a way to determine the age of globular cluster stars. - For stellar clusters, the MS-turnoff is an indicator of its age
Perryman et al. (1997) — Hertzsprung-Russell diagram for stars in the solar neighborhood, which distances have been determined by the Hipparcos spacecraft.
The main sequence (MS)
- The place in the HR-diagram where stars burn ("fuse") hydrogen
- Stars follow a mass-luminosity relationship
![]() with
with
![]() for low-mass MS-stars
for low-mass MS-stars
This means high-mass stars quickly leave the MS, while low-mass stars are still on the MS
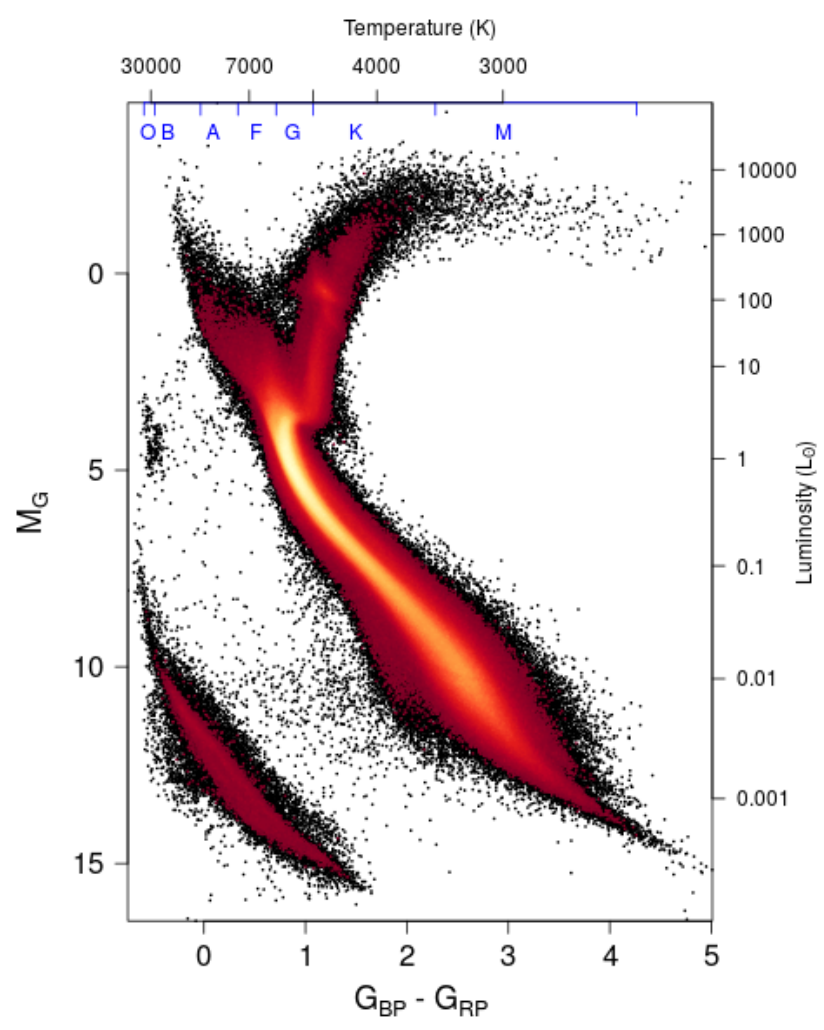
The main-sequence turnoff is a way to determine the age of globular cluster stars. - For stellar clusters, the MS-turnoff is an indicator of its age
Question: What does the branch (A) below the MS represent?
Gaia Collaboration et al. (2018) — 20 years later, there is Gaia.
The main sequence (MS)
- The place in the HR-diagram where stars burn ("fuse") hydrogen
- Stars follow a mass-luminosity relationship
![]() with
with
![]() for low-mass MS-stars
for low-mass MS-stars
- For stellar clusters, the MS-turnoff is an indicator of its age
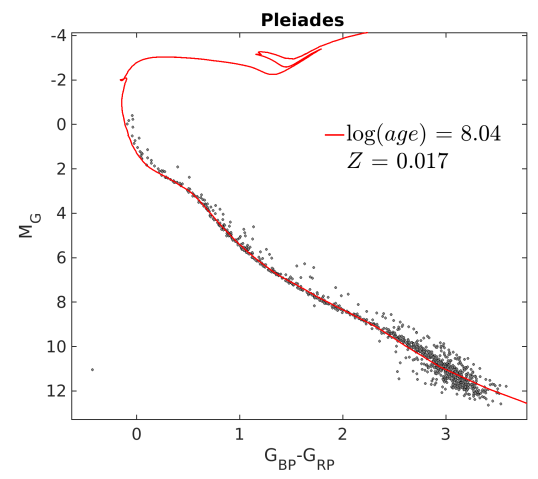
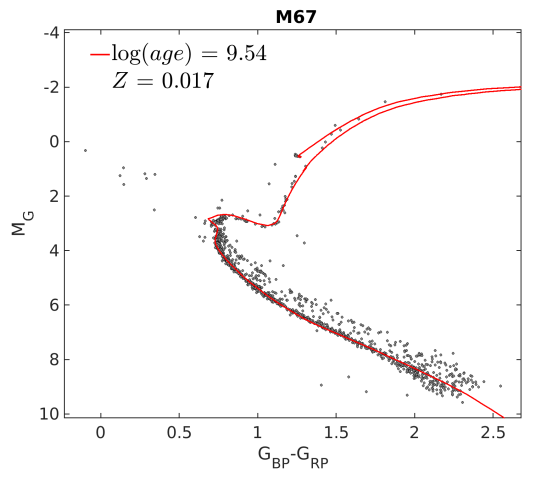
After the main sequence
- Stars will ascend the Red Giant Branch and (later) the Asymptotic Giant Branch
The evolution depends on stellar mass and also metallicity
- The final outcome depends mainly on the (initial) stellar mass:
| mass | core-burning | shell burning | outcome |
|---|---|---|---|
| ~0.1 | H (convective) | none | He WD |
| ~0.1—0.5 | H | H | H/He WD |
| ~0.5—2.3 | H, He | H | CO WD |
| ~2.3—8 | H, He | H,He | C-rich WD |
| ~6.0—8 | H, He,C | H,He | O-rich WD |
| >8 | H, He,..., Si | various | core collapse Supernovae |
Question: These helium white dwarfs haven't been observed yet. Why not?
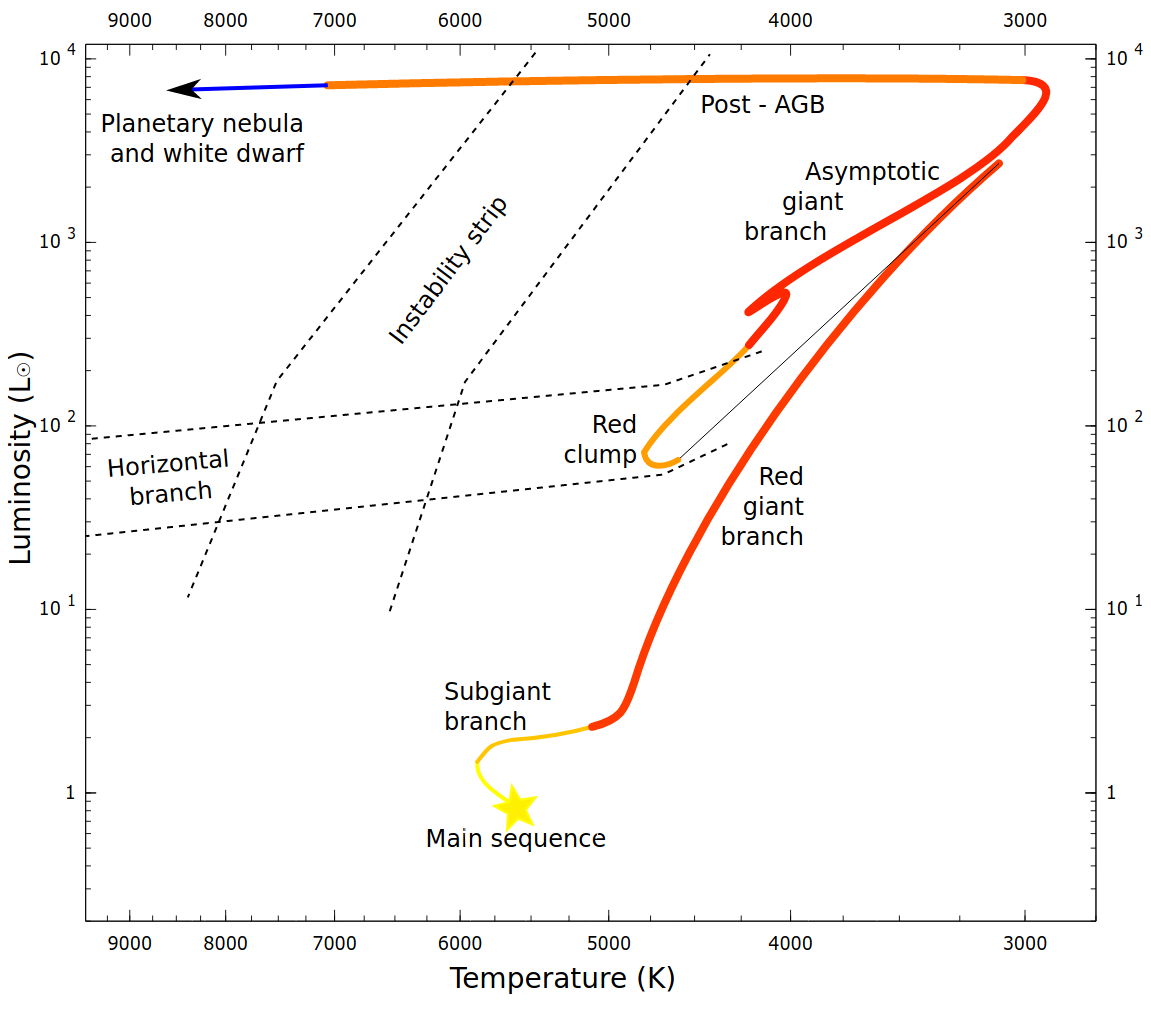
Evolution of a solar-mass star
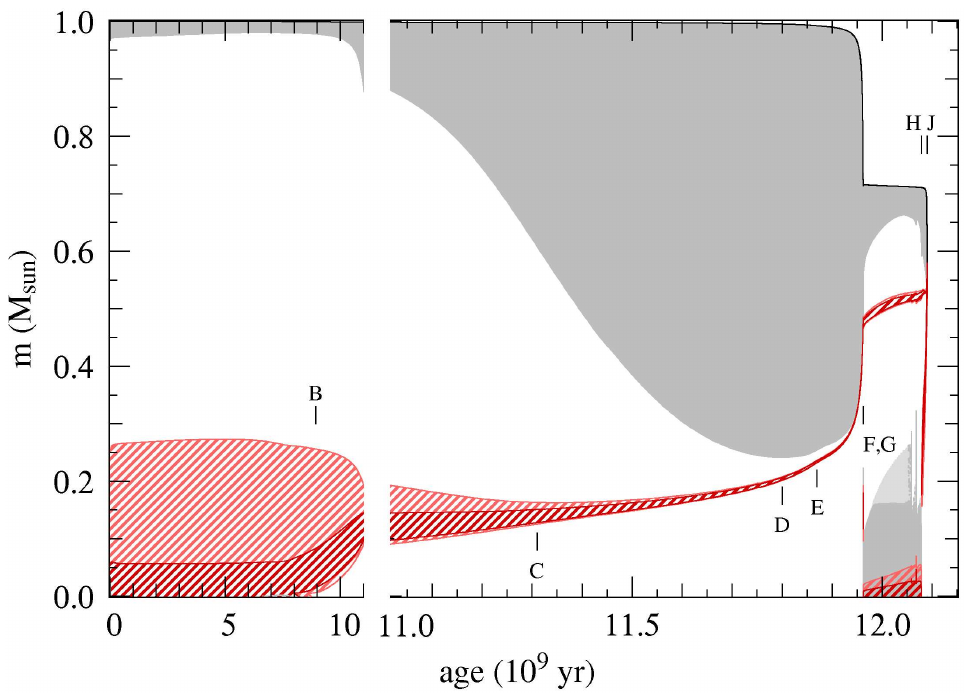
Left: Example of a so-called Kippenhahn diagram — evolution of the internal physical structure with time. Red-shaded regions denote nuclear burning, grey convection. Right: corresponding curves in the HR-diagram. (c) Onno Pols
fusion
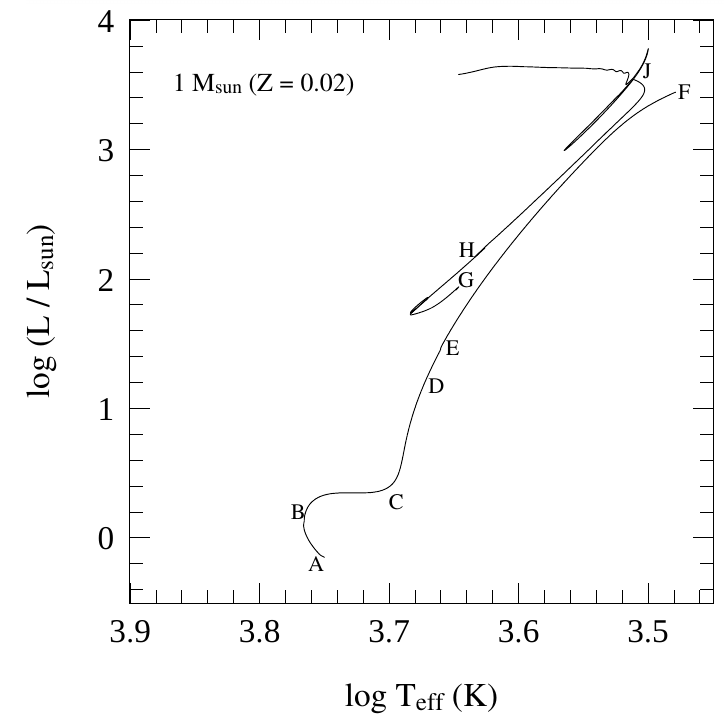
(B) hydrogen is exhausted in the center; onset of H-shell burning; growth of envelope.
The H-shell burning and the contraction of the (near-)degenerate He core, cause the envelope to expand!
The underlying reason is that nuclear reaction are very sensitive to temperature; a tiny increase in T (due to contraction of the shell), greatly increases the luminosity output
Evolution of a solar-mass star
Left: Example of a so-called Kippenhahn diagram — evolution of the internal physical structure with time. Red-shaded regions denote nuclear burning, grey convection. Right: corresponding curves in the HR-diagram. (c) Onno Pols
Q: Why does the convective zone grow during the RGB phase

fusion

(C) the expanding envelope becomes convective; the star moves up ("ascend") the Red Giant Branch (RGB).
The He-degenerate core contracts and grows; Luminosity and nuclear burning increase, resulting in higher mass (and smaller!) core; the high temperature gradient ensures that the nuclear burning shell is thin
Evolution of a solar-mass star
Left: Example of a so-called Kippenhahn diagram — evolution of the internal physical structure with time. Red-shaded regions denote nuclear burning, grey convection. Right: corresponding curves in the HR-diagram. (c) Onno Pols

fusion

(D-F) an accelerating evolution along the red giant branch.
The envelope has by now become largely convective (high luminosity and high opacity!); evolution along the Hayashi line
Evolution of a solar-mass star
Left: Example of a so-called Kippenhahn diagram — evolution of the internal physical structure with time. Red-shaded regions denote nuclear burning, grey convection. Right: corresponding curves in the HR-diagram. (c) Onno Pols
Q: Why doesn't the energy liberated in the He flash come out?

fusion

(F) He is (explosively) ignited in the degenerate core
A Helium flash occurs; the He-burning is (for a short period) out of control, reaching power levels comparable to the galaxy. However, most of the generated energy does not reach the surface. Because the degenerate core's pressure is insensitive to temperature. We do not observe this as the energy goes into internal energy, lifting the degeneracy!
Evolution of a solar-mass star
Left: Example of a so-called Kippenhahn diagram — evolution of the internal physical structure with time. Red-shaded regions denote nuclear burning, grey convection. Right: corresponding curves in the HR-diagram. (c) Onno Pols

fusion

(G-H) He core burning
He-core burning expands the core and causes the envelope to shrink. These He-burning stars occupy the so-called Horizontal branch
Evolution of a solar-mass star
Left: Example of a so-called Kippenhahn diagram — evolution of the internal physical structure with time. Red-shaded regions denote nuclear burning, grey convection. Right: corresponding curves in the HR-diagram. (c) Onno Pols

fusion

(H-J) He shell burning; the star ascends the Asymptotic Giant Branch (AGB)
On the AGB the star may experience strong pulsations, sheds its outer envelope to the ISM, before its He-fuel is exhausted. A degenerate C/O-core remains as a White Dwarf
High-mass star evolution
— read CO Ch. 15.3 —
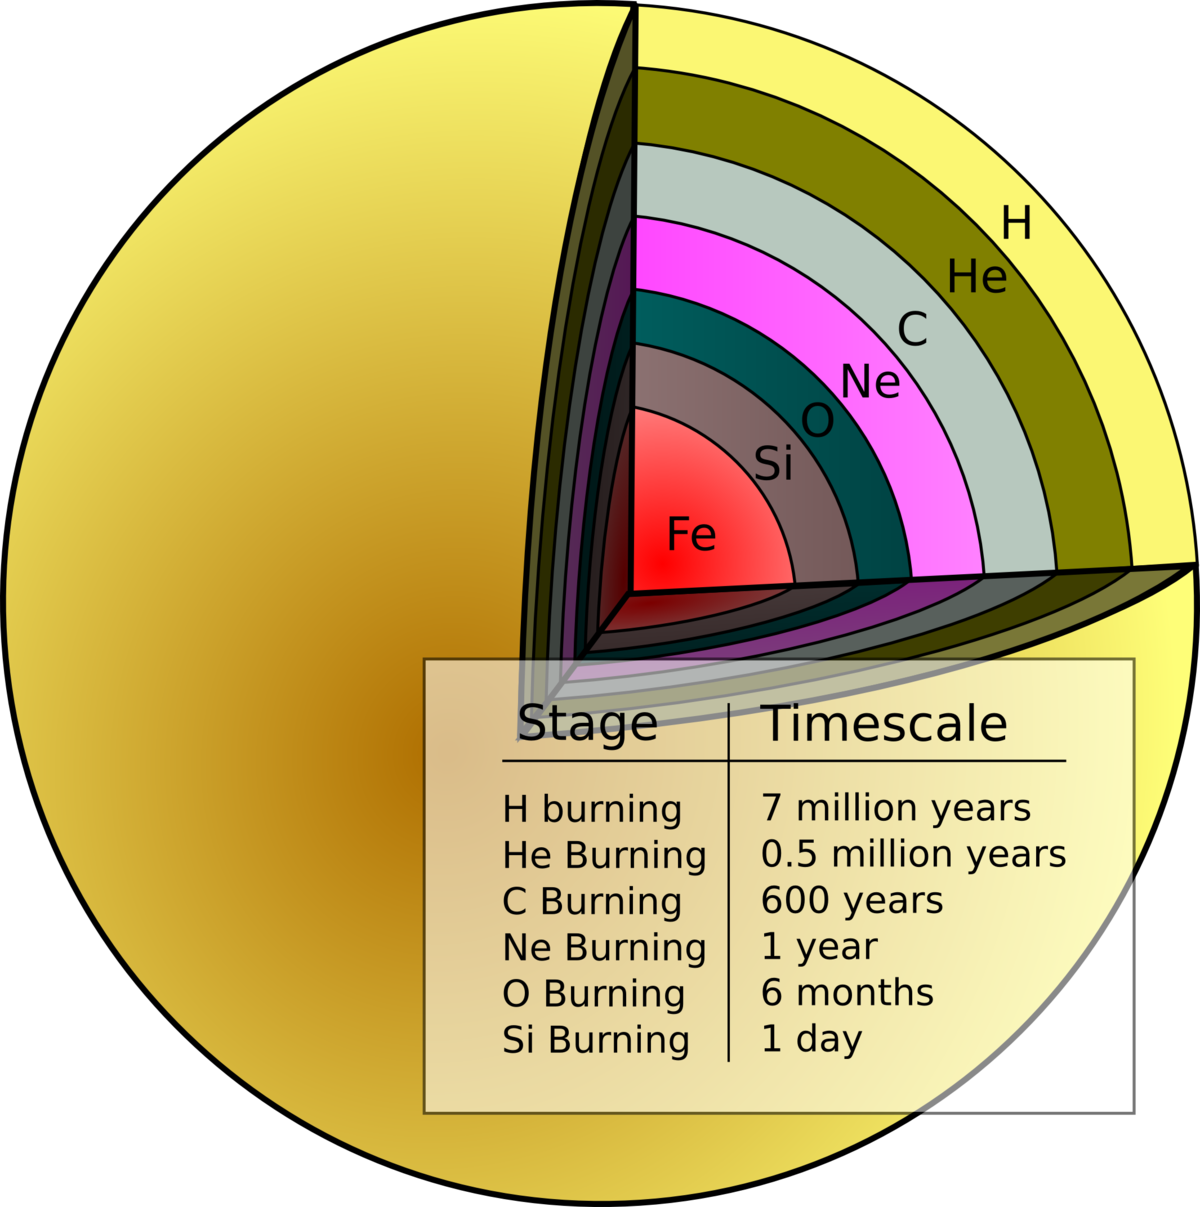
- In high-mass stars, a progression of burning cycles results in an onion-shell structure
- Since Fe-burning would consume energy, the core collapses and heats up
- Photons become energetic enough to disintegrate the Fe-group heavy nuclei
(photo-disintegration)
This reverses the nuclear fusion in a few seconds! For example:
![]()
- Under the high density and temperatures, protons and electrons combine (electron capture)
this releases a huge amount of neutrinos (cooling)
- Collapse is halted by degenerate pressure from neutrons core-collapse (Type II) supernovae
supernova in the Whirlpool galaxy
background image source: APOD
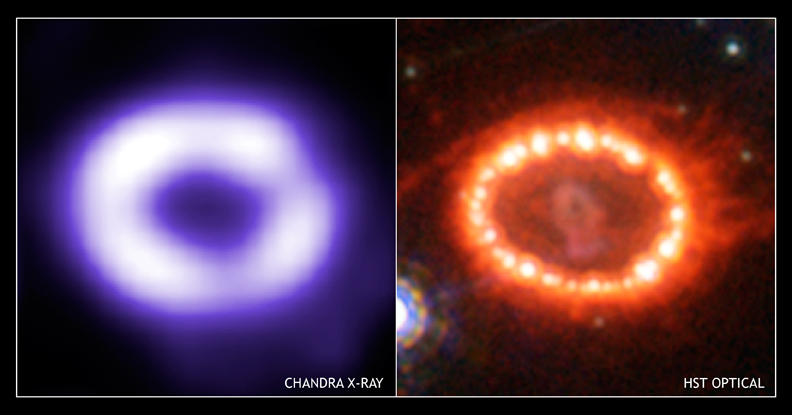
Supernovae 1987A
(c) Hubble Space Telescope/NASA, ESA; R. Kirshner, and M. Mutchler; R. Avila
Supernovae 1987A
(c) Hubble Space Telescope/NASA, ESA; R. Kirshner, and M. Mutchler; R. Avila
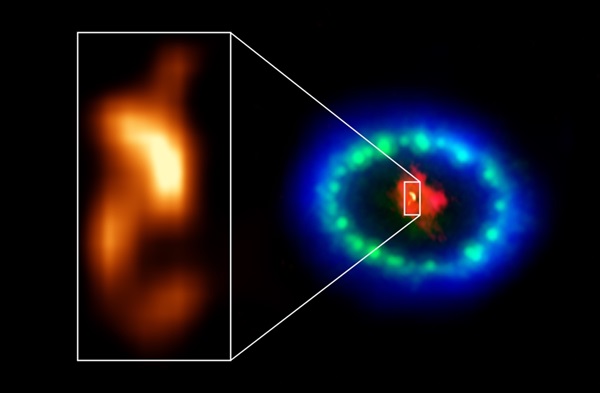
SN 1987A Is the most-studied supernovae. It exploded in 1987 in the Large Magellanic Cloud (LMC). See astronomy.com article
nucleosynthesis
— read CO p.542 —
Nucleosynthesis describes the process of producing the atomic nuclei. We distinghuish:
- big-bang nucleosynthesis, responsible primarily for the Y=25% cosmic mass fraction of H-1, H-2, He-3, and He-4
- stellar nucleosynthesis for the heavier elements by nuclear fusion
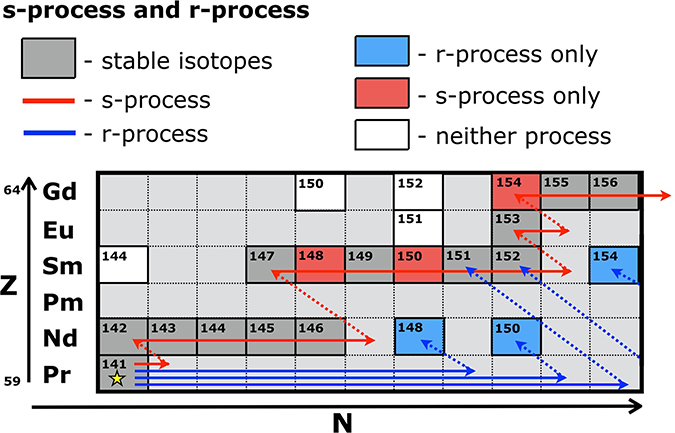
Elements heavier than Fe are produced by neutron (n) capture
-
s-process
("slow"): n-capture produces an unstable isotope and is followed by β-decay
β-decay:
![]() (for a free neutron)
(for a free neutron)
- r-process ("rapid"): successive n-captures possible, due to extremely high neutron fluxes (as in core-collapse supernovae)
end of module 5
—congrats—


